
IDE-like test debugging
over 2 years ago by Ben Wu
07-24-2023
Thanks to feedback from developers, we've built the following new features that are comparable to those found in code IDEs.
- App debugging
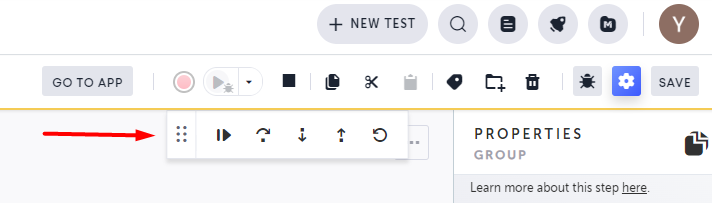
You can now debug Testim tests via the editor (documentation here) with:- Floating debug toolbar with these activities: pause/continue, step over/step into/step out, and rerun
- Local run (without debugging): skip existing breakpoints
- Debug helper panels
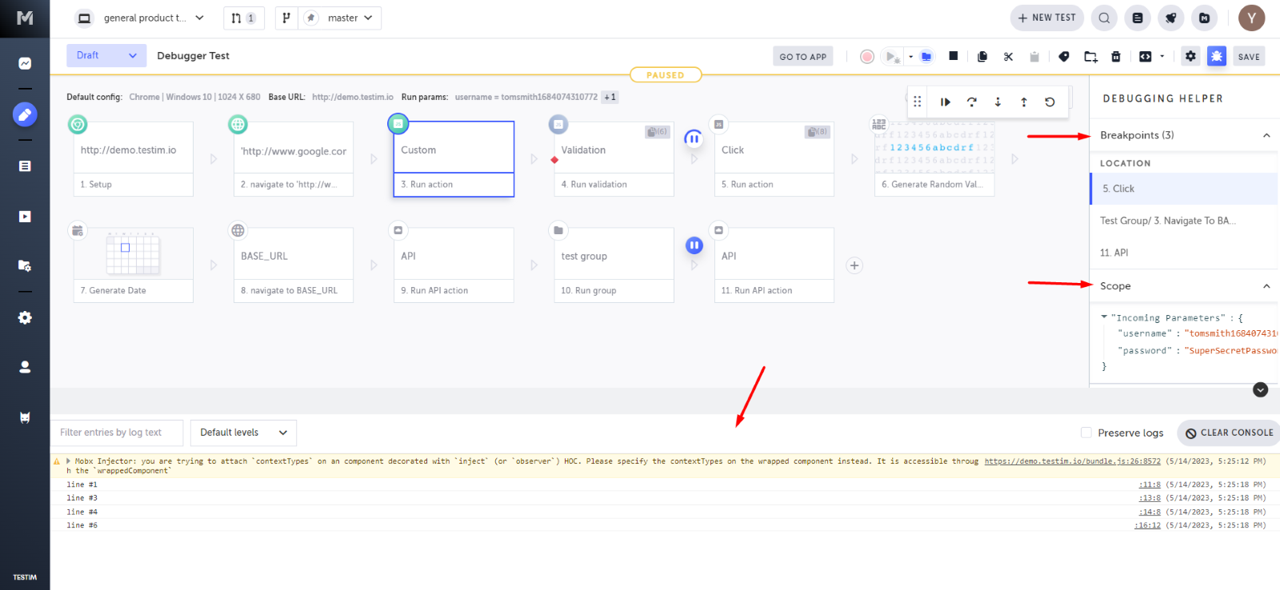
New helper panels for debugging and issue resolution (documentation here) include:- Console log: helps identify errors or unexpected behavior by outputting variable values and debugging info
- Breakpoint manager: helps you manage breakpoints in the test. Breakpoints pause test execution, allowing step-by-step inspection of variables. This aids in pinpointing errors or unexpected behavior
- Scope: gives you info about the current parameter values in the test and helps you understand the structure of the test and how data is passed between test steps
NOTE: auto-opening the panels can be controlled via project settings.
- JS code debugging
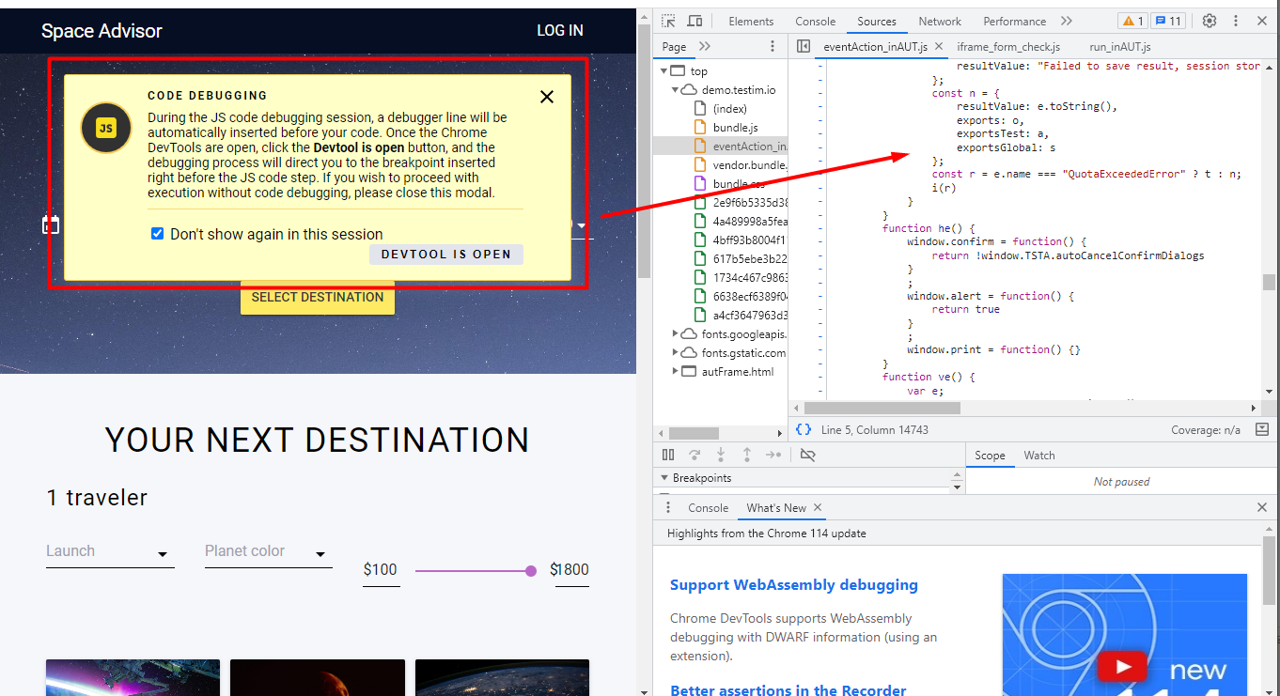
You can now debug coded steps from within the editor by using Chrome DevTools for comprehensive code debugging (documentation here). Here's how to debug:- Set a breakpoint before the step you want to debug
- Click the 'step into' button in the new debugging toolbar
- Approve the necessary popups in the AUT (additional one-time popups may appear)
- Use Chrome DevTools for debugging
- Click 'resume script execution' in the debugger. Once code debugging is complete, you'll be paused back at the editor
[block:image]
{
"images": [
{
"image": "https://files.readme.io/f469ba0-js_code_debugging.png", "", "" ], ,
"align": "center"
}
]
}
[/block]