
JS Code Debugging
Use Chrome Developer Tools to debug JS code in code-based steps
Some steps in Testim (see list of supported steps below) offer the ability to use JS code within the step, which is entered into the Function Editor. When the test is executed, this code is executed on the AUT, which runs on the web browser. Testim allows you to debug the JS code using the standard Chrome DevTools. As part of this process the Chrome DevTools is opened in the AUT browser window, specifically pointing to the step's code. So users can utilize the debugging capabilities provided by Chrome DevTools. Once the debugging is complete, the session seamlessly returns focus back to the Testim Editor.
Supported steps
- Add custom action
- Add custom validation
- Add custom wait for
- Validate email
- Add network validation
- API validate
- API action
Debugging the JS Code in a supported step
The procedure below shows how to debug the JS code inside a previously created Custom Action step in an existing test, but the same applies to all supported steps.
To debug the JS code:
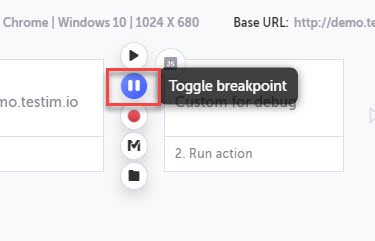
- Insert a breakpoint right before the Custom Action step. This can also be virtual breakpoint. for example, a virtual breakpoint after a 'step over'.
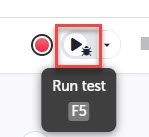
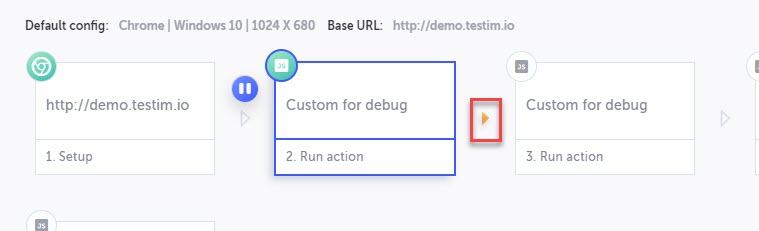
- Run the test locally in debug mode.
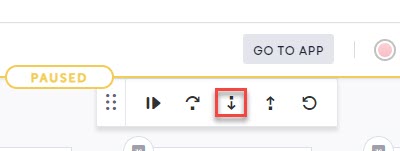
The test is run, while displaying the debugging controls. - When the test reaches the breakpoint, click the Step Into button on the debugging controls menu.
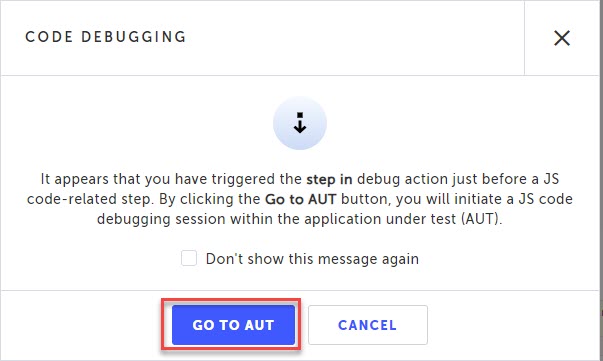
The following notification appears:
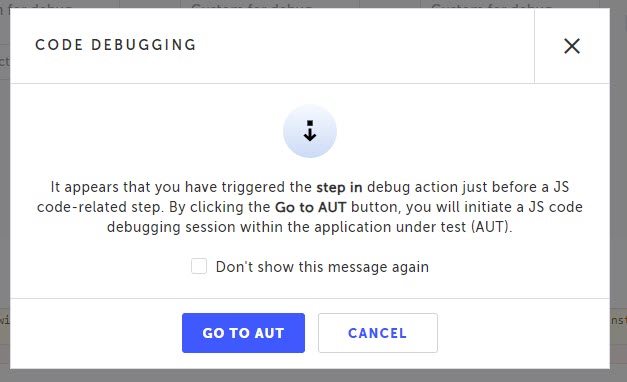
- Click Go To AUT.
The AUT is displayed with a Code Debugging message.
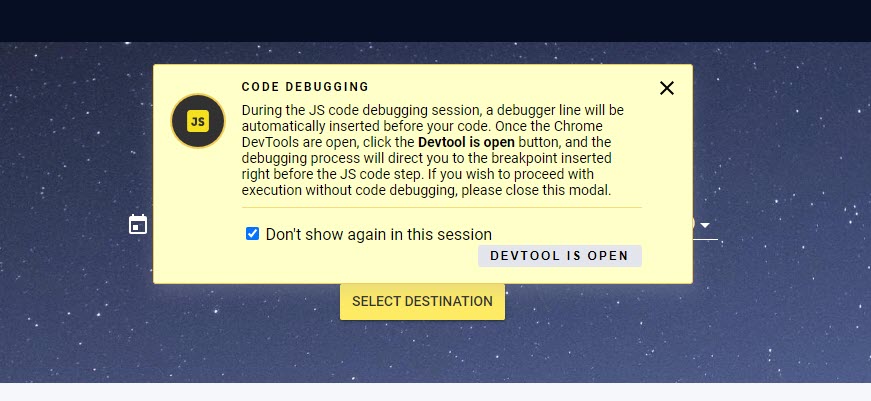
- On the AUT's web browser open the Chrome Dev Tools (Win - 'Ctrl + Shift + I' & 'F12' and 'Inspect' from browser right click; Mac - 'Ctrl + Option + I' and 'Inspect' from browser right click).
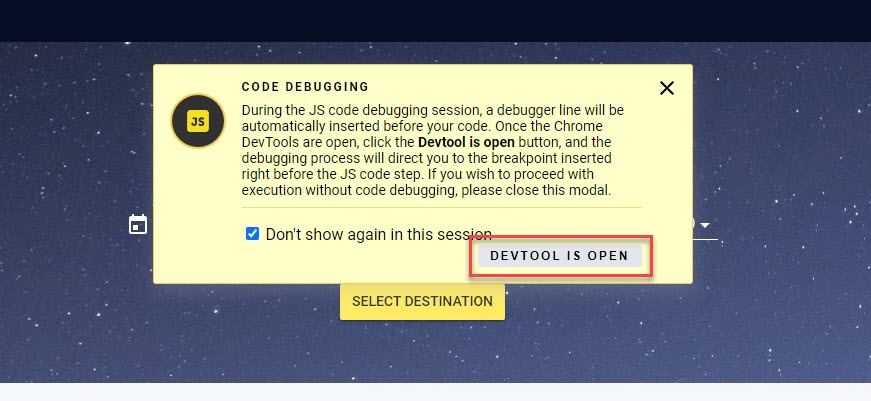
- On the message itself, click the DEVTOOL IS OPEN button. If you leave the Don't show again in this session checkbox selected, you will not have to perform this step during this session, which means for other steps in the same test.
The developer tool displays the code-level breakpoint just before the added JS code, while displaying a “debugger” line right before the JS code from the step. - At this point you can use the Chrome Devtools debugging capabilities to debug the JS code.
- After finishing debugging the JS code, on the AUT, click the Result Script Execution button.

The following message appears:
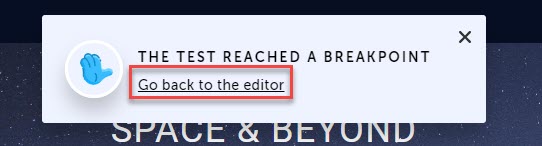
- Click the Go back to the editor link.
Focus will go back to the Testim editor, while displaying a virtual breakpoint after the debugged step. At this point you can proceed with the debugging process or save the test with the changes.
Updated 9 months ago