
Execution Runs Screen
View results & statistics of executions
An Execution is set of one or tests that are run as a single run. Executions can be initiated automatically (e.g., by a Scheduler) or manually (e.g., through a CLI running tests that include a certain label). The Execution Runs screen displays information about previous execution runs. These runs are grouped by Suite, Label, or Test plan (as opposed to the Test runs view, which present each one of the executed tests as separate entry in its list view).

Note:
Tests run directly in the Test Editor will not appear in the Execution Runs.
Executions List
The execution list displays information about the individual execution runs.

- Execution: the name of the execution. Execution Name provides additional details about how the execution was run, see Execution name conventions below for more details. Click the Execution Name to see the Execution Details.
- Branch: name of the test branch of the execution
- Browser (web): the browser used in the execution
- Device (mobile): the physical or virtual device used in the execution
- OS (mobile): the operating system of the physical or virtual device used in the execution
- Started: the time the execution began
- Duration: the duration of the execution
- Concurrency: number of tests that ran in parallel.
- Results: number of passed/failed tests
- Result labels: the result labels that were added to the run. See Result labels for more info.
- Status: the current execution status. The possible status values include:
- Passed - all the tests in the execution have passed.
- Failed - at least one of the tests in the execution have failed.
- Queued - the execution is waiting to be processed.
- Running - the execution is being processed.
- Aborted - the execution has been stopped/aborted.
- Timeout - the execution has net returned a result within the configured timeout period. The timeout status is not necessarily a final status, see note below for more details.
Temporary Timeout Status
If an execution's overall time takes more than 90 min, its status will change from ‘RUNNING’ to ‘TIMEOUT’. However, since there is no continuous connection between Testim and the Grid, the tests may still be running on the grid after the timeout period. In this case, when all tests are finished (and the execution is done), the execution status will be updated accordingly from ‘TIMEOUT’ to ‘FAILED’/’PASSED’.
Execution Name Conventions
The Execution Name provides additional details about how the execution was run.
| Execution Name | Description |
|---|---|
| Remote run (Testim Editor) | When running specific test/s remotely (on grid) from the test library |
| Local suite | - When running specific test/s locally from the test library - When running specific suite/s locally from the suite library If a single test is run from the Test Editor, it will not be displayed. |
| <Suite name> or <Label name> or <Test plan name> | - When running specific suite/s and/or label/s using CLI - When running specific test plan/s using CLI If multiple Test plans are run using CLI or scheduler, there will be multiple execution entries, where each test plan will have its own execution entry. |
| <Scheduler name> | When running specific scheduler with label or suite |
| <Scheduler name>//<Test plan name> | When running specific scheduler with test plan/s If multiple Test plans are run using the CLI, each test plan will have it on execution entry |
Statistics Panel
The statistics panel displays aggregated statistics on the execution runs currently displayed.

- Success Rate: displays a percentage of execution runs where all tests passed. In the example above 67% (2 out of 3) execution runs in the list passed.
- Executions Passed: displays the total number of execution runs that passed.
- Average Duration: displays the average time it took Testim to complete each execution run. In the example above, there were 3 runs (1 minute, 2 minutes, and 37 seconds), for an average of 1 minute 13 seconds.
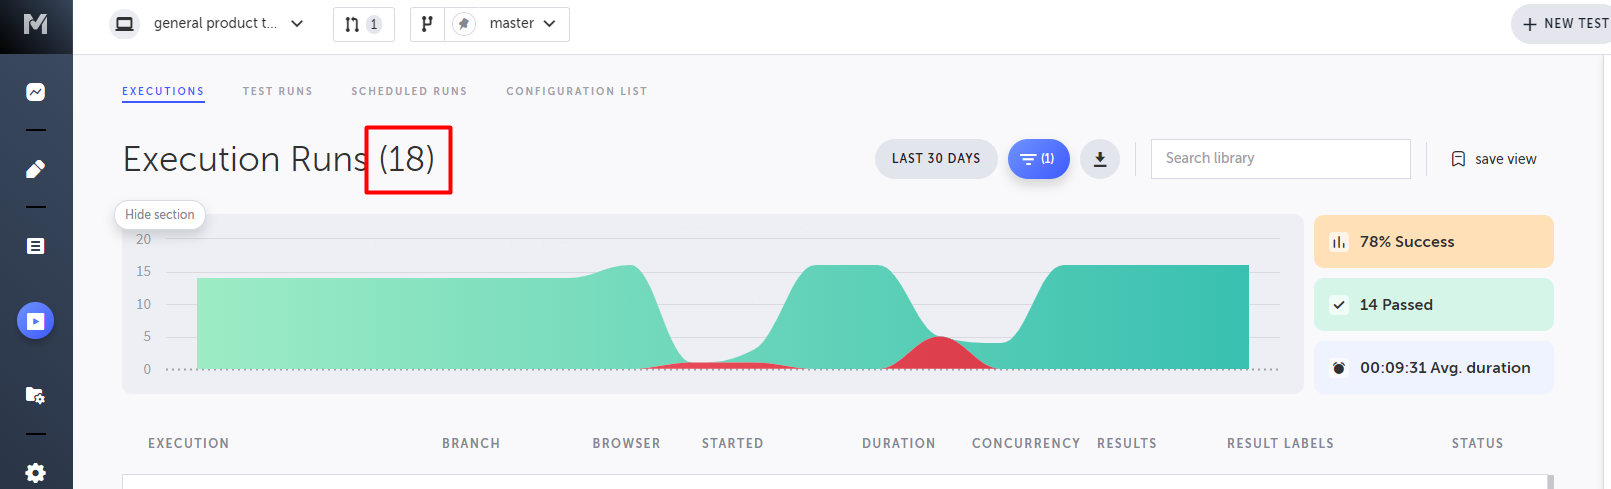
Execution Runs Graph
The execution runs graph gives you an overview of the number of executions and the tests per execution. You can drill down and inspect a specific execution to see the results of each test. You can also filter by status, time, and execution/label. Hover over the graph to view details about each run.

- X Axis: displays a compressed timeline that includes the times when the executions took place.
- Y Axis: displays the number of executions.
Hide/Show Execution Runs Graph
To hide the execution runs graph:
- Click the Hide section button above the graph.

Testim will collapse and hide the graph.
- To show the graph again, click the Show section button beneath the Execution Runs title.

Testim displays the graph.
Execution Operations
The operations panel gives you the ability to filter the execution runs list and export the list. The following actions are available:
- Filter by Run Date: display only executions that were run during a designated timeframe.
- Advanced Filters: display only executions based on status, browser, test plan, label, or branch.
- Export Execution List: download the list of executions currently displayed in CSV format.
- Search Execution List: search for execution(s) by name and only display executions that match the search criteria.
Filter by Run Date
To filter execution runs by date:
- Click the Filter by Date button in the operations panel.

- Select from the predefined list of filters or choose a custom date range.

Testim will automatically filter the executions list based on the timeframe selected. To learn more about saving this filtered view, see Saving a Filtered View. The number next to the title displays the number of executions that match the selected filter:
Advanced Filters
To apply advanced filters to the executions list:
- Click the Advanced Filters button in the operations panel.

Testim displays the Filter Execution Runs panel.

- Select the desired filters and click the Apply button to apply the filters to the execution list. To learn more about saving this filtered view, see Saving a Filtered View.

- To remove all filters, click the Reset filters link in the advanced filters panel.

The number next to the title displays the number of executions that match the selected filter:

Export Execution List
To export the currently displayed execution runs list:
- Click the Export Execution List button in the operations panel.

Testim will generate a CSV file for you to download locally.
Search for Execution Runs by Name
To search for execution runs by name:
- Enter the Execution Name in the search box of the Operations Panel.

Testim displays only the execution runs with a matching execution name.

Execution Details Screen
You can view additional details of a specific execution on the Execution Details screen.
To view the details of an execution:
- Double-click one of the executions in the Execution List.

Testim displays the Execution Details Screen.

Execution Details
At the top of the Execution Details Screen, the basic information about the execution is displayed, including:
- Name of the execution
- Total number of tests in the execution
- Total number of tests executed
- Execution Run ID
Note:
The Execution Run ID is helpful when conducting detailed debugging on a specific execution.
Execution Test Statistics
The statistics panel displays aggregated statistics for the specific execution run currently viewed, including:
- Success Rate: displays a percentage of tests that passed. In the example above 100% (8 out of) tests in the list passed.
- Tests Passed: displays the total number of tests that passed.
- Average Duration: displays the average time it took Testim to run each test in the execution. In the example above, there were 8 tests run, for an average of 11 seconds each.
Execution Test List
At the bottom of the Execution Details screen is a list of tests included in the execution. For each test, the following information is displayed:
- Test Name: the name of the test.
- Browser (web): the browser used in the execution
- Device (mobile): the physical or virtual device used in the execution
- OS (mobile): the operating system of the physical or virtual device used in the execution
- Started: the time the test began
- Duration: the duration of the test run
- Result labels: the result tags.
- Failure Type: if the test failed, displays the type of failure. The possible failure type values displayed are:
- Bug in app
- Environmental Issue
- Invalid test data
- Test design
- Other
- Untagged
- Status: the current execution status. The possible status values displayed are:
- Passed
- Failed
- Queued
- Running
- Aborted
- Timeout
Temporary Timeout Status
If an execution's overall time takes more than 90 min, its status will change from ‘RUNNING’ to ‘TIMEOUT’. However, since there is no continuous connection between Testim and the Grid, the tests may still be running on the grid after the timeout period. In this case, when all tests are finished (and the execution is done), the execution status will be updated accordingly from ‘TIMEOUT’ to ‘FAILED’/’PASSED’.
- Information Icon: by hovering over the information icon you can get additional details about the test including:
- Status
- Base URL (web): used to conduct the test
- Device Info (mobile): includes the device name and operating system of the physical or virtual device used to record the test
- Application (mobile): mobile app name used to record the test
- Test Data: used to conduct the test. Click See Test Data to view the parameters that were used in the test.
Test Operations
From the Execution Details screen you are able to take various actions and see additional technical details about the execution:
- Abort an execution that is currently running
- Rerun a single test
- View detailed debugging information
- View Test History
- Tag Failure Type
- Filter tests displayed in the Execution Details
- View Test Details
Abort an Execution Currently Running
When viewing the Execution Details Screen while the tests are running, you are able to abort the execution run and prevent any further tests from running.
To abort an execution run:
- On the Execution Runs screen, double-click an execution that is currently running.
- Click the Abort Run button:

Testim will stop the execution run.
Note:
The “Abort Run” button is only available for actively running remote editor runs/scheduler/local executions. See
CLI for more details on how to abort a CLI execution.
Rerun Test Directly from Execution Details Screen (Web)
While on the Execution Details screen, you can rerun a test.
Command line interface (CLI)
To rerun a test from the Execution Details screen:
- On the Execution Details screen, select one of the tests in the test list.

- Click the Rerun with same params button in the action panel. You can also right click on any test in the test list and select Rerun with same params.

Testim will run the test as if you were in the Test Editor.
View Detailed Debugging Information
From the Execution Details Screen, you can view additional information about the run that is helpful when debugging.
To view detailed debugging information:
- From the Execution Details Screen, hover over the Information Icon in the operations panel.

Testim displays the following information:
- Concurrency - the number of executions that ran concurrently with the current execution.
- Extension Version - the version of the Testim extension that ran the execution.
- Source - how the execution was run (local, remote, etc.)
- CLI Version - version of the CLI used to run the extension
- Grid Name - name of the grid used to run the execution
- Test Data - view parameters and other test data used to run the execution
View Test History
From the Execution Details Screen you can view the history of a specific test in the execution. This will give you information about past test runs.
To view the test history from the Execution Details Screen:
- Right click the test row and select Test History.

Testim displays the test history only for that specific test.
Tag a Test Failure
When a test fails, you can tag the failure with a specific failure type.
To tag a failure type from the Execution Runs screen:
- Right click a the failed test in the test list and select Tag failure type.

- Complete the tag test failure screen. For more information, see Tagging failed runs with failure types.

Filter Tests Displayed in the Execution Results Screen
By default, Testim will display all tests included in the execution on the Execution Results Screen. However, you can filter the tests for a more refined view.
To filter the tests displayed in the Execution Results Screen by Status:
- Click the Advanced Filters button in the operations panel.

- Select one or more values from the Status section of the filter’s panel.

- Click the Apply button to apply the filters to the execution list.

To filter the tests displayed in the Execution Results Screen by Test Owner:
- Click the Advanced Filters button in the operations panel.

- Select one or more values from the Test Owner section of the filter’s panel.

- Click the Apply button to apply the filters to the execution list.

To filter the tests displayed in the Execution Results Screen by Failure Type:
- Click the Advanced Filters button in the operations panel.

- Select one or more values from the Failure Type section of the filter’s panel.

- Click the Apply button to apply the filters to the execution list.

View Test Details
From the Execution Results Screen, you can navigate directly to the Test Run and view the step-by-step details of the test. This is helpful if you want to see which step of the test failed.
To view step-by-step details of a test in an execution run:
- From the Execution Results screen, double-click anywhere on test in the test list.

Testim displays the detailed steps of the test.

Updated 5 months ago