Network Logs
Network logs include information about requests between the web browser and the site being tested. During the test execution, network logs are collected and displayed as part of the test results. The network logs can be viewed at the step level or at the test level.
Viewing the network logs at the step level
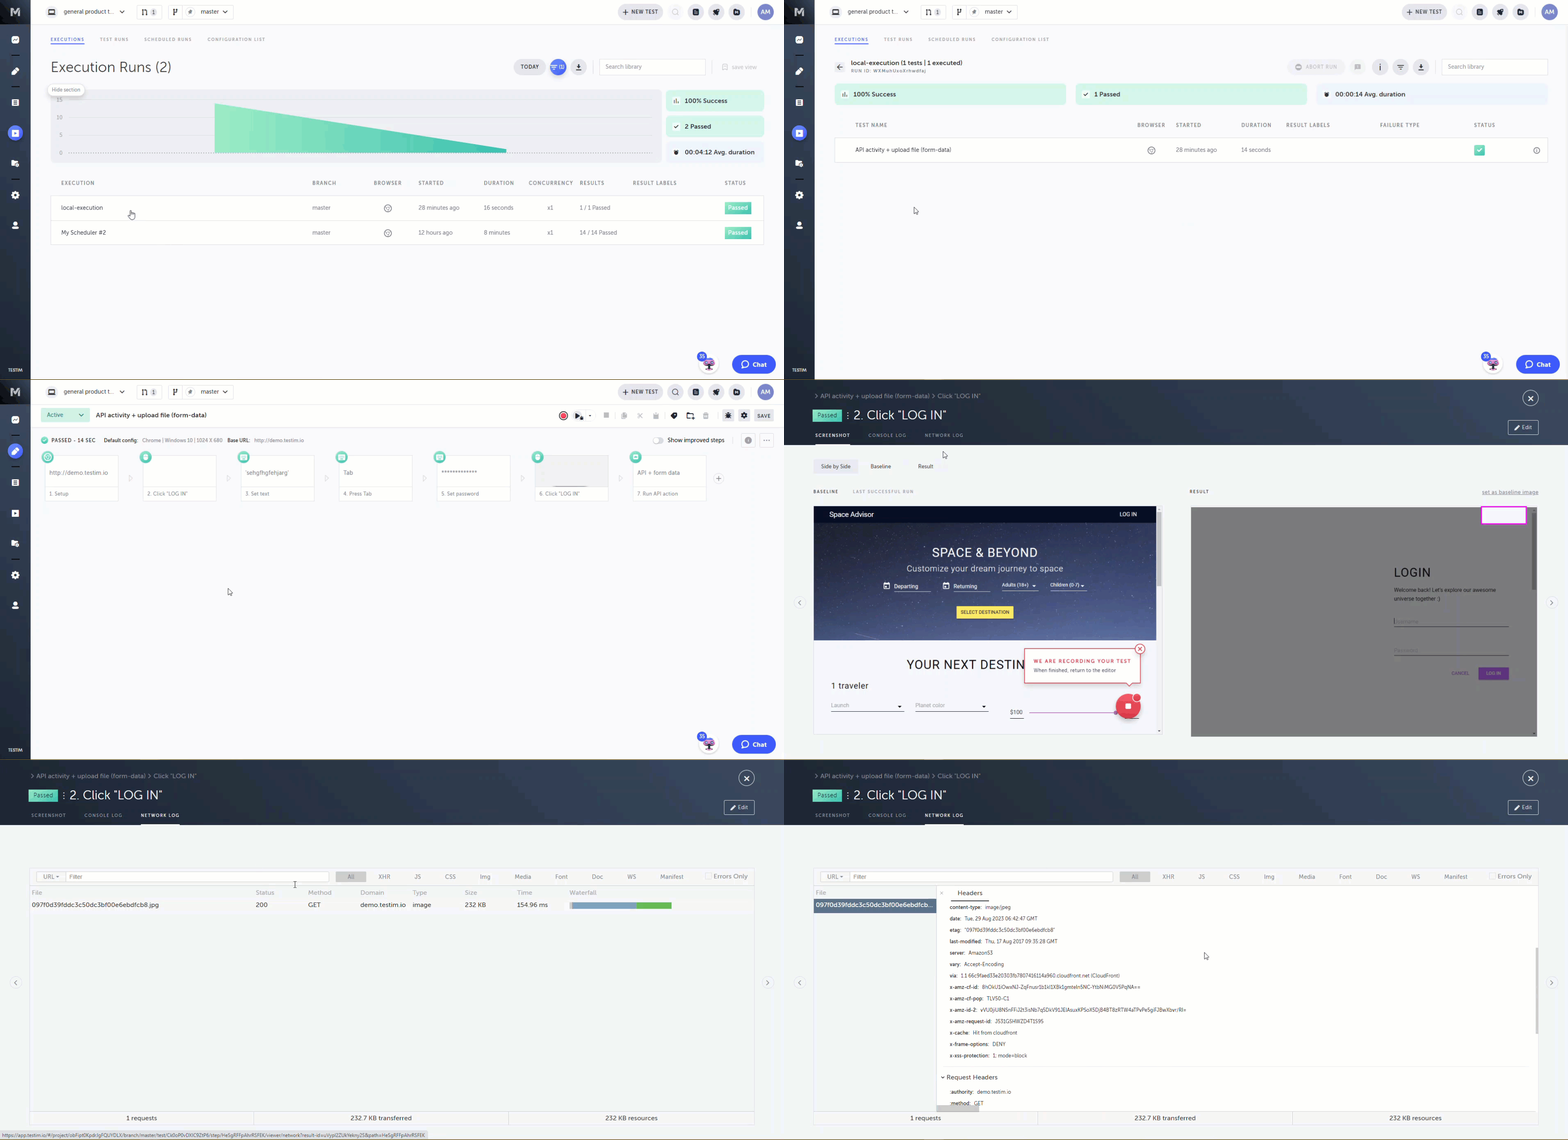
To view the network logs of a step:
- Run the test.
- On the main menu, click Runs.
- Click the relevant execution.
- On the Execution screen, click the relevant test.
The test is displayed with the executed steps marked as passed or failed. - Click the View Screenshot button on the relevant step.
- Click the Network Log tab.
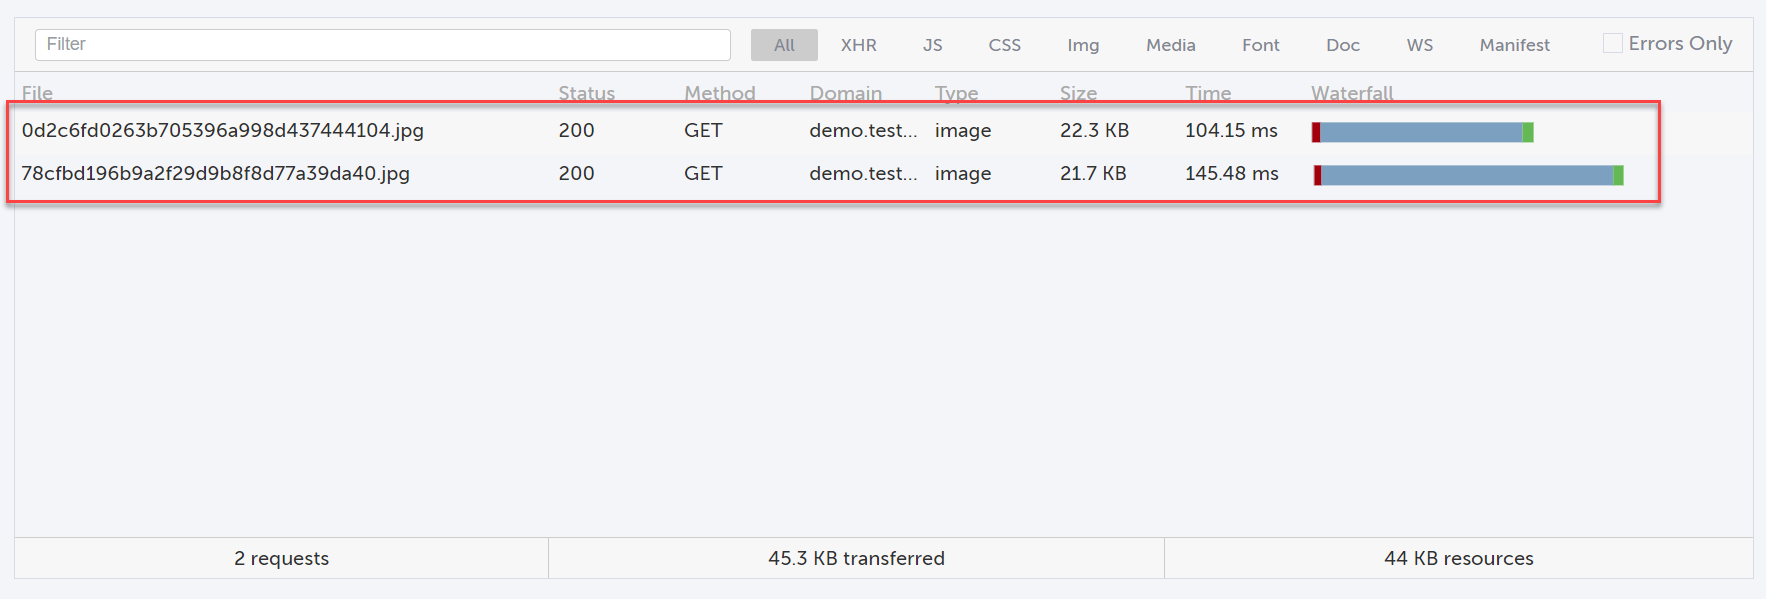
You can filter your results by several elements. Clicking on a request reveals the HTTP headers associated with that request.
You can view the request results for previous and next steps by clicking on the arrows on the left and right sides of the screen.

The information displayed for each request is described in the following table.
| Item | Description |
|---|---|
| File | The name of the file |
| Status | The HTTP status code |
| Method | The HTTP request method |
| Domain | The domain to which the request was made |
| Type | The request type (i.e. XHR, JS, CSS, etc.) |
| Size | The response size (including headers and body) |
| Time | The duration from the start of the request to the receipt of the response |
| Waterfall | A visual breakdown of the request activity |
Filtering request results
You can filter your results by filename text, domain, type, and errors.
To filter by filename text and domain:
- In the Filter box, enter your filter criteria.
 The results are instantly filtered based on text in the File and Domain columns.
To filter by request type:
- In the request results table header, select one of the request types. Options include XHR, JS, CSS, Img, Media, Font, Doc, WS, and Manifest.

The results are instantly filtered based on your selection.
By default "All" is selected. You can choose only one request type to filter at a time.
To filter by requests with errors:
- In the request results table header, select the Errors Only checkbox.

Only those results with errors are shown.
Viewing HTTP headers
You can view the HTTP header data for each request.
To view the HTTP headers:
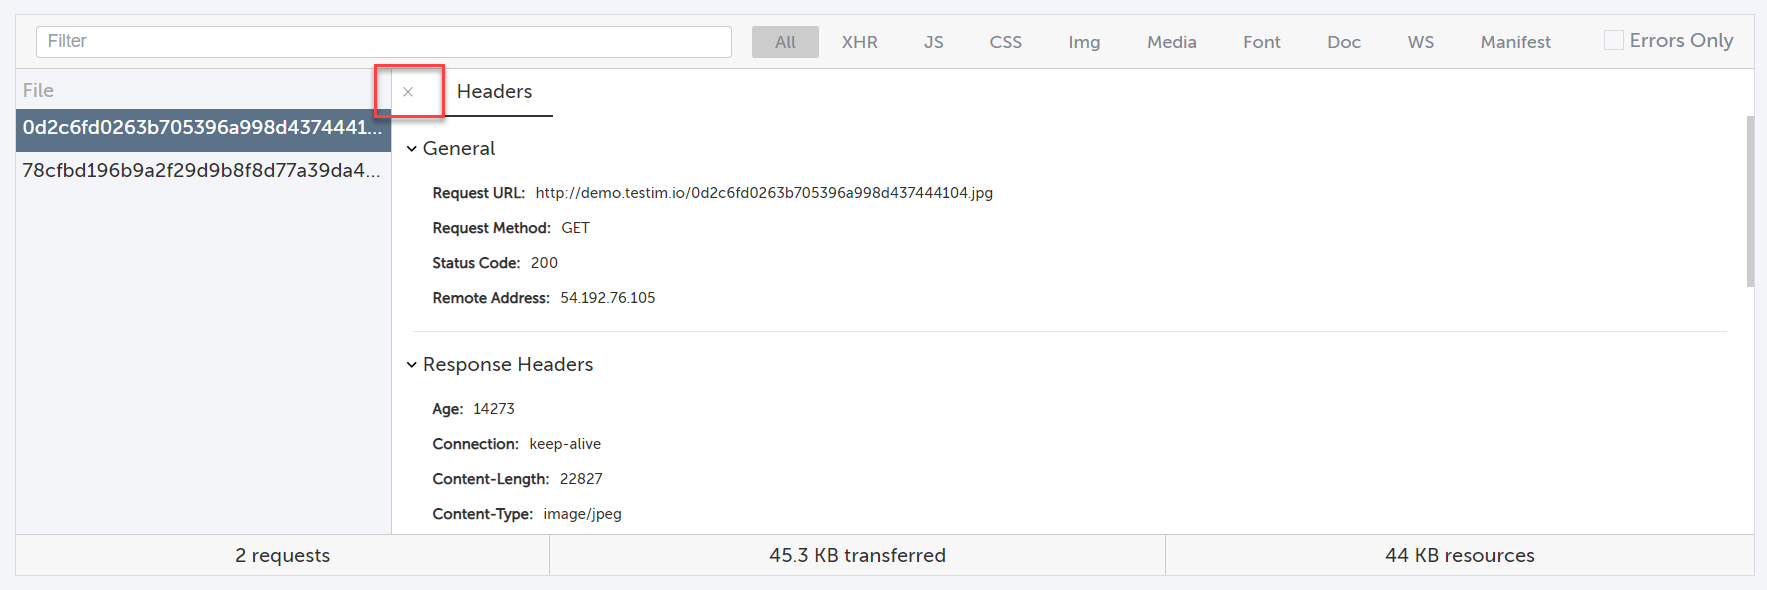
- Click any of the rows containing request data.

The Headers window opens comprised of three sections: General, Response Headers, and Request Headers.

- Close the Headers window by clicking on the X in the upper left corner.

Each of the three sections of the Headers window can be minimized and expanded by clicking on the expand arrow to the top left of each section.
Viewing the network logs at the test level
You can view aggregated network logs for the entire test in one place. The test network logs can be used to debug failed test runs and better understand the test results.
To view the network logs of a test:
- Run the test.
- On the main menu, click Runs.
- Click the relevant execution.
- On the Execution screen, click the relevant test.
The test is displayed with the executed steps marked as passed or failed. - Click the horizontal three-dot menu and click View network log.
You can filter your results by several elements. Clicking on a request reveals the HTTP headers associated with that request.

The information displayed for each request is described in the following table.
| Item | Description |
|---|---|
| File | The name of the file |
| Status | The HTTP status code |
| Method | The HTTP request method |
| Domain | The domain to which the request was made |
| Type | The request type (i.e. XHR, JS, CSS, etc.) |
| Size | The response size (including headers and body) |
| Time | The duration from the start of the request to the receipt of the response |
| Waterfall | A visual breakdown of the request activity |
This is only supported on Chrome browsers
The HAR file will not include the response body, due to privacy and security reasons
To create and download a full HAR, please use the mock networks
Downloading the HAR File
To download the HAR file:
- From the test screen, click the HAR button.
The Network Activity screen is displayed. - Click the Download button and save the file.

- It is recommended to upload the file to the dev tools, further debugging and analysis.
Viewing the network activity
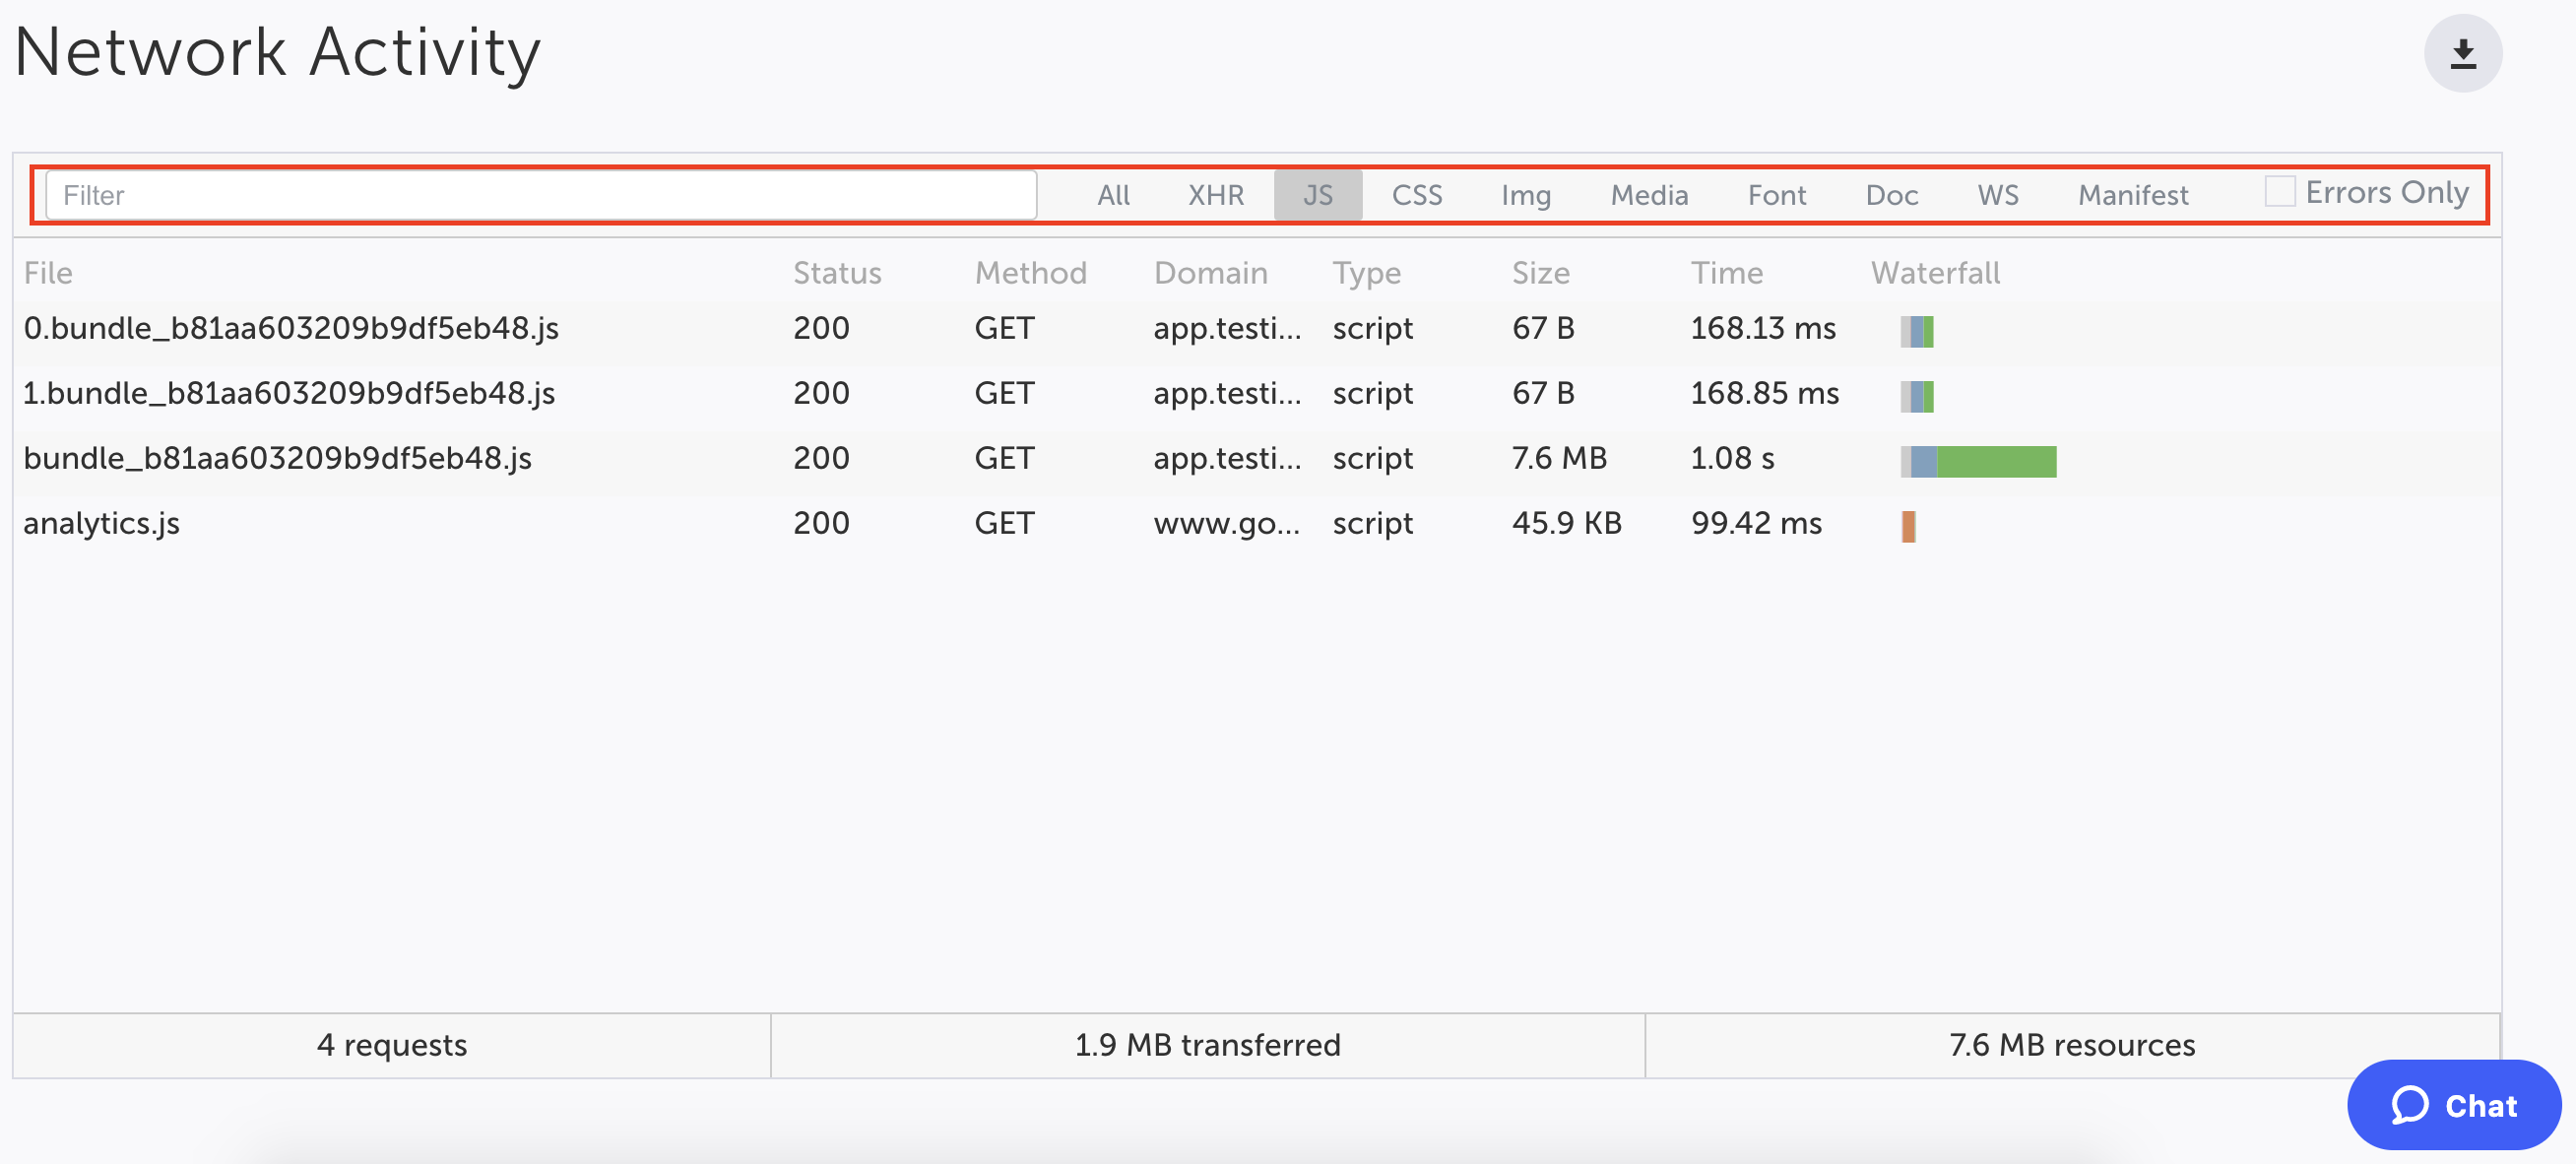
The Network activity screen displays the network traffic. You can filter the network traffic by using the following filter tools:
- Filter based on filename - enter a complete or partial file name into the Filter field.
- Filter based on the request type - select on of the lister request types (e.g. XHR, JS, CSS, etc.)
- Error only filter - select the Error Only checkbox to see only requests that were responded with an error.

The network activity entries include the following information:
- File - the URL of the request
- Status - the HTTP response code
- Request method - the HTTP request method
- Request domain
- Request type
- Size - the response size
- Time - the time it took to get the response
- Waterfall - a graphical representation of the different stages of the request. Hover over a Waterfall to see a breakdown.
The summary pane at the bottom contains:
- Total number of requests
- Total download size of requests
- Total size of resources loaded
Updated 8 months ago
