
TestOps Dashboard
The TestOps Dashboard provides important statistics with quick access to tests, remote execution runs, and other activities in your project allowing you to analyze the health of your project and focus your efforts on tests that may require your attention. You can choose the branch of your project for which you want the information displayed. For more information see Selecting a Branch.
By default, the information shown on the TestOps Dashboard is based on tests, pull requests, and audit log activities owned by any team member of the project. If you want to only view information about tests, pull requests, and audit log activities owned by you, click the Assigned to me toggle in the upper-right of the screen.
The TestOps Dashboard only presents features available in your plan. To learn more about our professional plan, click here.
The TestOps Dashboard is divided into five sections:
- Remote Execution Runs – shows detailed information about the remote execution runs performed on tests.
- Test Overview – shows how all of the tests in your project are distributed among the various test statuses.
- Duplication Level – shows the auto grouping score for your project.
- Recent Activity – shows the recent activity/events in your project.
- Pull Requests – shows information about the pull requests for your project. (This section is only shown when the master branch is selected.)
Assigned to Me

When the Assigned to me toggle is on, the following sections are adjusted to only reflect the data specific to the logged-in user. (The data in the Duplication Level section does not change.)
- Remote Execution Runs – changes to Remote Test Runs. For more information, see Remote Runs Pane - Assigned to Me.
- Test Overview – shows how the user’s tests are distributed among the various test statuses.
- Recent Activity – shows the user’s recent activity/events.
- Pull Requests – shows information about pull requests owned by the user.
Remote Execution Runs

The Remote Execution Runs pane shows detailed information about the remote execution runs performed on tests in your project during the selected time period and filter. Remote execution runs include suite runs, plan runs, scheduled runs, and tests that ran with a label.
You can select the reporting time period by using the dropdown menu in the top right corner of the pane. Options are: Last 24 Hours (default), Last 3 Days, and Last 7 Days. You can also filter the results, and save the filter settings.
The following information describes this pane when the Assigned to me toggle is off. For information about this pane with the toggle is on, see Remote Runs Pane - Assigned to Me.
The left pane shows the distribution of passed/failed remote execution runs for the selected time period/filter as follows:
- Green – indicates the total number of remote execution runs that passed.
- Red – indicates the total number of remote execution runs that failed.
The right pane lists the last failures of your most recent executions during the selected time period and filters. The following information is shown about the most recent remote execution runs that failed during the selected time period/filter:
- The name of the remote execution run. (You can click on the name to open the Execution Run Details page which includes detailed results of that execution. For more information, see Execution Run Details View.)
- The reason for the most recent failure (in red).
- When the most recent execution was run.
- The number of tests in the execution that passed out of the total number of tests in that execution.
- The total number of times this execution failed during the selected time period (in pink). (You can click on this number to open the Execution Run Details page, filtered by this specific execution name and time period.)
A maximum of 50 failed execution runs are shown. To see all of your execution runs (including the runs that passed), click See all to open the Execution Runs screen. For more information, see Execution runs view.
Remote Runs Pane - Assigned to me

When the Assigned to me toggle is on, this pane changes from Remote Execution Runs to Remote Test Runs, and the information shown switches from remote execution runs performed on tests in your project to remote test runs on tests in your project owned by you.
The left pane shows the distribution of passed/failed remote test runs for the selected time period/filter as follows:
- Green – indicates the total number of remote test runs that passed.
- Red – indicates the total number of remote test runs that failed.
The right pane lists the last failures of your most recent tests during the selected time period and filters. The following information is shown about the most recent remote test runs that failed during the selected time period/filter:
- The name of the remote test that failed. (You can click on the name to open the test page for that test.)
- The name of the execution containing the failed test (in grey). (You can click on the name to open the Execution Run Details page which includes detailed results of that execution. For more information, see Execution Run Details View.)
- When the test was most recently run.
- The total number of times this test failed during the selected time period (in pink). (You can click on this number to open the Test Run Details page, filtered by this specific execution name and time period.)
Selecting the Time Period
You can select the time period for the information shown in this pane. Changing the time period does not affect the data in the other panes on this page.
To select the time period:
- Click the time period button.

The time period options are shown.

- Select your desired time period.
The data in the pane is automatically updated based on the time period specified.
Filtering the Results
You can filter the remote execution runs shown in this pane by suite, label, plan, scheduler, and result label. By default, the data included in the results does not include test runs that have the test status of evaluating; however, you can include these test runs by sliding the “Include Evaluating” toggle in the filter settings to the right. For more information on test status, see Test Status. For more information on result labels, see Result labels.
To filter the results:
- Click the Filter button.

The Filter Remote Runs pane opens on the right-hand side, showing the execution run types you can filter by (Execution, Label, Plan, and Scheduler) and the Result Labels you can filter by. (The Result Labels shown are based on the terms you have previously used to label your results. For more information, see Result labels.)

- To filter by a specific execution type, select the type and then select the desired checkbox(es) shown under that type. (You cannot choose more than one execution type to filter by.)

You can also search for criteria by clicking on the Search (magnifying glass) icon and entering your search criteria in the search box that opens.
-
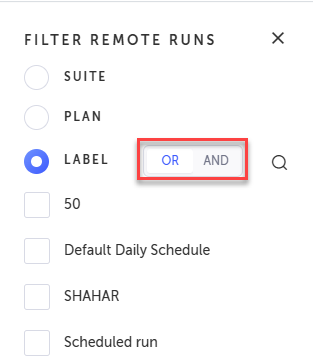
To filter by Label, select the Label option, select one or more of the labels listed, and then select one of the following operands:
-
OR - will return tests that include one or more of the selected labels.
-
AND - will only return tests that include ALL the selected labels.
-
-
To filter by result label, select the desired checkbox(es) in the Result Label section.
You can also search for criteria by clicking on the Search (magnifying glass) icon and entering your search criteria in the search box that opens.
- If you want to include the data from test runs with a test status of evaluating, click the Include Evaluating toggle. A test with the status of evaluating is still being evaluated by the user, so by default the data from its runs is not included. For more information on test status, see Test Status.

When including the evaluating tests, only the tests that were run on a grid or via CLI are included in the results.
- Click Apply.
The filter is applied, and only the data that meets the criteria is shown.
You can remove the filters by clicking on Reset filters and then Apply in the bottom of the pane.
- Click the “X” in the upper right of the pane to close it.
Closing the Filter Remote Runs pane without resetting the filters will not reset them, and only the data that meets the filter criteria will be shown. To include data for all of your remote execution runs again, you will need to reopen the Filter Remote Runs pane and reset the filters.
- If you want to save your current filter settings for the next time you access the TestOps Dashboard, click save view. (The save view option is only available when viewing the TestOps Dashboard within the context of a pinned branch.) See Saving a Filtered View for more info. Your filter settings will be saved until you pin a different branch, at which point the filters will be reset. For more information, see Pinning a Branch.

Test Overview

The Test Overview pane shows how all of the tests in your project are distributed among the various test statuses. (If Assigned to me is selected, this pane shows how the user’s tests are distributed among the various test statuses). The test statuses are:
- Active – these are tests that are ready and stable.
- Quarantine – these are unstable tests, which means that they generate errors, and are waiting to be fixed.
- Evaluating – these tests are ready but their stability should be examined.
- Draft – these tests are not ready to be used yet (i.e. still in progress).
- Flaky – these tests are unstable, which means that they sometimes fail and sometimes pass.
For more information on test status, see Test Status. For more information on flaky tests, see Flaky tests.
These values are not affected by the reporting time period and filters set in the Remote Execution Runs pane.
Clicking on any of these categories opens the Test Library filtered by the category you clicked on. For more information, see Test Library.
Duplication Level

The Duplication Level pane shows the auto grouping score for your project. Testim identifies duplicate test step sequences in your project for which you haven’t yet created a shared group, and assigns an auto grouping score to your project based on that information. A higher score indicates a higher amount of duplicate test step sequences that haven’t yet been put into a shared group. The lower the number, the “healthier” your project is.
This value is not affected by the reporting time period and filters set in the Remote Execution Runs pane.
Clicking on this pane opens the Auto Grouping page. For more information on auto grouping, see Auto grouping.
Recent Activity

The Recent Activity pane is an activity log that shows the recent activity/events in your project. (If Assigned to me is selected, this pane shows only the user’s recent activity/events.)
Each entry includes a link to the associated object/test. Project owners and company owners can click on See all to open the Audit Log. For more information, see Audit Log.
Pull Requests

The Pull Requests pane shows information about the pull requests for your project. (If Assigned to me is selected, this pane shows information only about pull requests owned by the user.) A pull request is a request made by a user who made a change to the test, asking for the change to be reviewed in order to merge it into the master branch of the project. This section is only shown when the master branch is selected.
If pull requests are currently disabled for your project, the following message is shown: “Pull Request is disabled for this project. Click here to enable the feature”. Clicking on Click here takes you to the Project Settings screen where you can enable this feature.
A bar graph and the number of pull requests is shown for the three pull request categories:
- Pending – the pull request was submitted, but has not yet been reviewed.
- Requested Changes – the reviewer of the pull request asked for changes.
- Approved – the pull request was approved, and it is possible to merge it to the master branch.
Clicking on a bar in the graph takes you to the Pull requests screen, filtered by the category you clicked on.
For more information on pull requests, see Pull Requests.
Updated 4 months ago