Debug console errors, access DOM
Debug using Chrome Console
You can use console.log(myVar) or use the chrome DevTools debugger to see errors while running the test (add a debugger to the code).
Debug console errors and network
Testim records console errors and network errors automatically.
To view errors in a test run:
- Navigate to your text run or execution.
- View the error messages at the top of the test and the specific test step that failed.
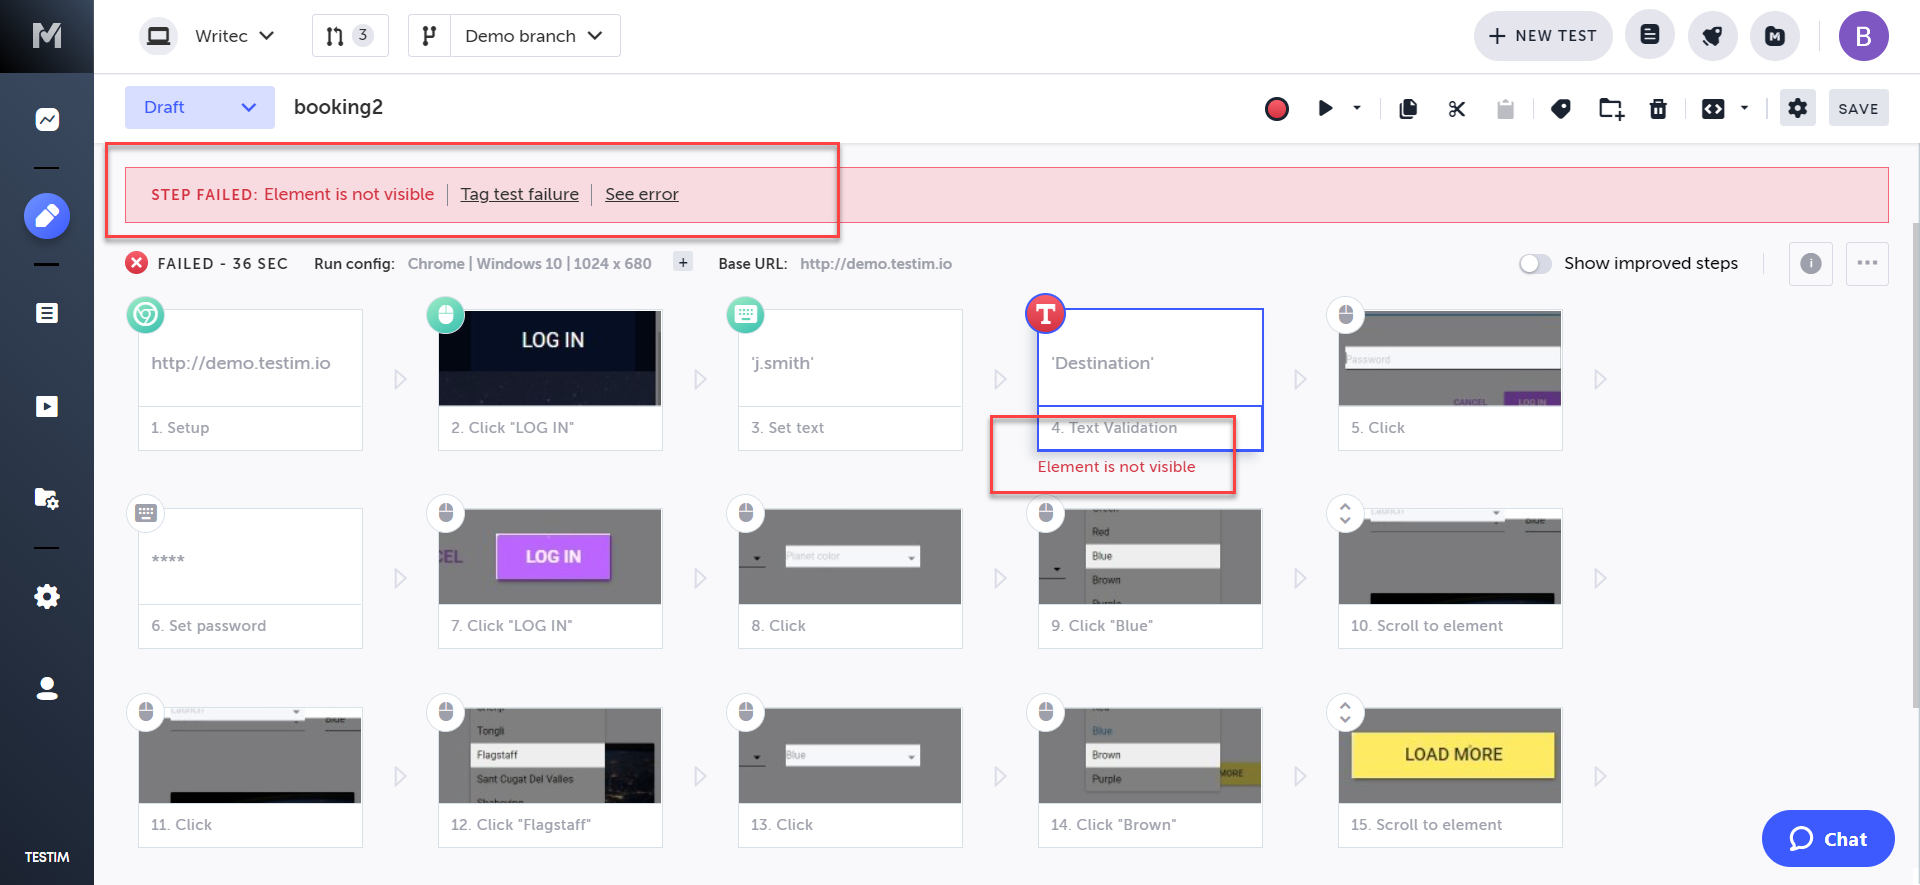
- Open the console log.
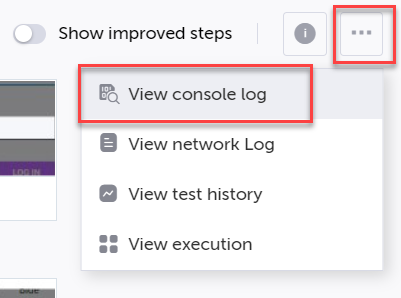
- View the console log to gain insight in the specific errors.

Note:The test logs will only appear for runs on Chrome & Edge Chromium browser.
Debug by seeing the failed step DOM
When a step fails, Testim saves a complete DOM snapshot, so you can later debug.
To view the DOM snapshot of an error:
- Navigate to your text run or execution.
- View the error messages at the specific test step that failed.
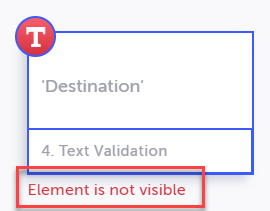
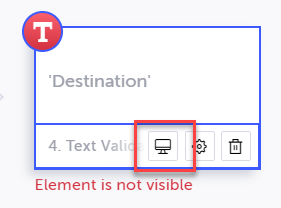
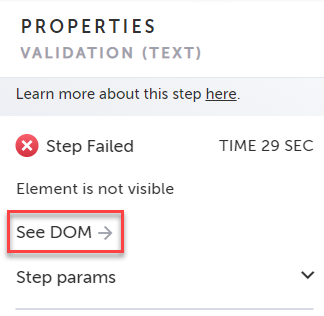
- To view the DOM snapshot, hover over the step and click the View screenshot button or click the View DOM link in the step's properties panel.
Note:
- The DOM will only appear on Chrome & Edge Chromium browser runs.
- The DOM will only appear on failed steps.
Debug Step parameters
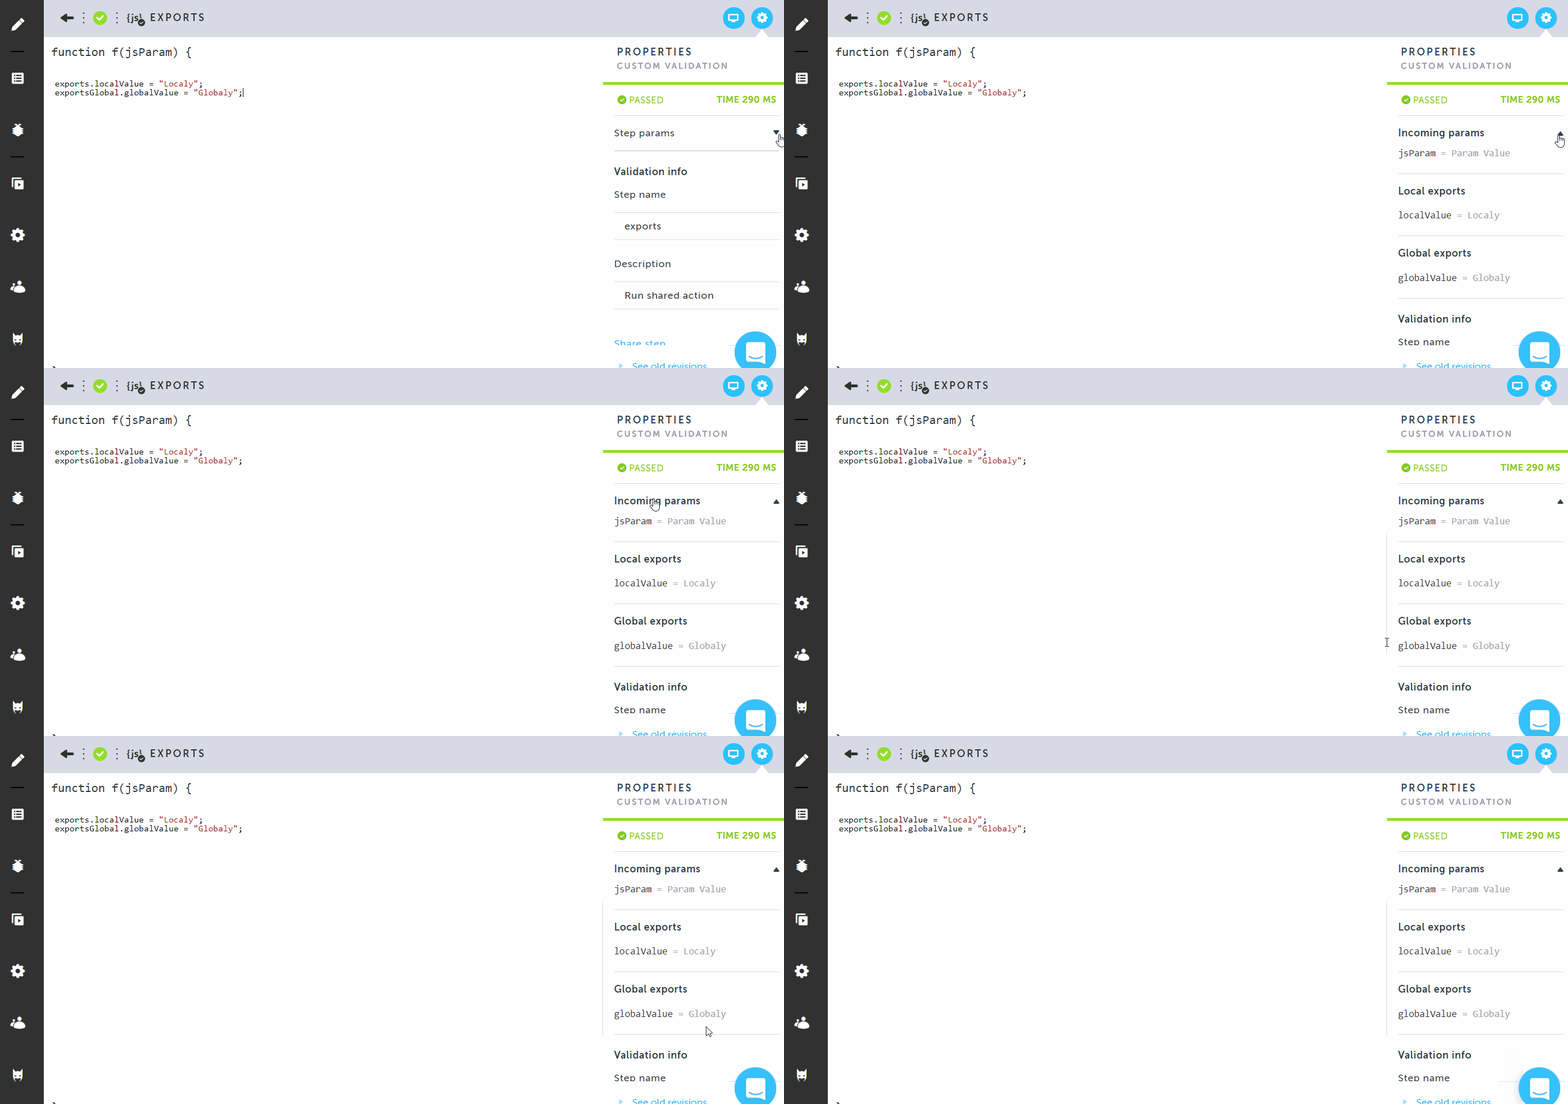
In the properties panel you can see in each step all the parameters used during the run. These parameters can help you understand what happened in each step during the run.
- Incoming params: All incoming parameters that could be used in this step. Parameters can come from the exports in previous steps, from global exports carried out from previous tests in the suite, from data driven parameters, group / step parameters, etc.
- Local exports: Export parameters created in this step.
- Global exports: Global export parameters created in this step.
Updated 6 months ago
