Reports
Get a view of your quality trends
The Reports tab on the Insights section shows detailed information about the quality of your project over a selected time period, including information about successful and failed test runs, the activity of your team, and information about which tests have failed the most. You can choose the branch of your project for which you want the information displayed. For more information see Selecting a Branch.
This page includes the following sections:
- Tests Run Results – shows information about the active tests during the selected time period.
- Your Team’s Activity – shows information about your team’s new and updated tests during the selected time period.
- Testim’s Activity – shows information about the number of times Testim’s locators were used to identify a modified element in your runs.
- Where Can You Improve? – shows information about the three tests that have failed the most during the selected time period.
You can select the reporting time period by using the dropdown menu in the top right corner of the page. Options are: Today, Yesterday, Last 7 Days (default), Last 30 Days, Last 3 Months, and Custom. You can also filter your results.
The following users will receive a "Testim weekly report" summary via email:
- Company owners - by default, receive a weekly report via email for all company projects.
- Project owners - by default, receive a weekly report via email for their specific project(s).
- Company and project owners - can configure to send weekly reports to additional users by adding their email addresses under the Reports tab in project settings.
Company owners and project owners can access an additional company-level report. For more information, see Company-level Report.
Tests Run Results
The Tests Run Results section includes information about your tests, and passed and failed test runs for the currently selected time period. A test run is defined as a single execution of a single test with specific parameters, run in a specific browser. An execution includes test/s that were run by means of the CLI/scheduler/UI list, where you can select multiple tests to be run by a single command.
The Tests Run Results section includes the following panes:
- Passed Test Runs – shows detailed information about the test runs that have passed during the selected time period.
- Running Tests – shows detailed information about the tests that were run during the selected time period.
- Avg. Duration – shows information about the test run duration.
- Failure Types – shows detailed information about the test runs that have failed during the selected time period, based on how you tagged those failed tests. For more information about tagging failed tests, see Tagging failed runs with failure types.
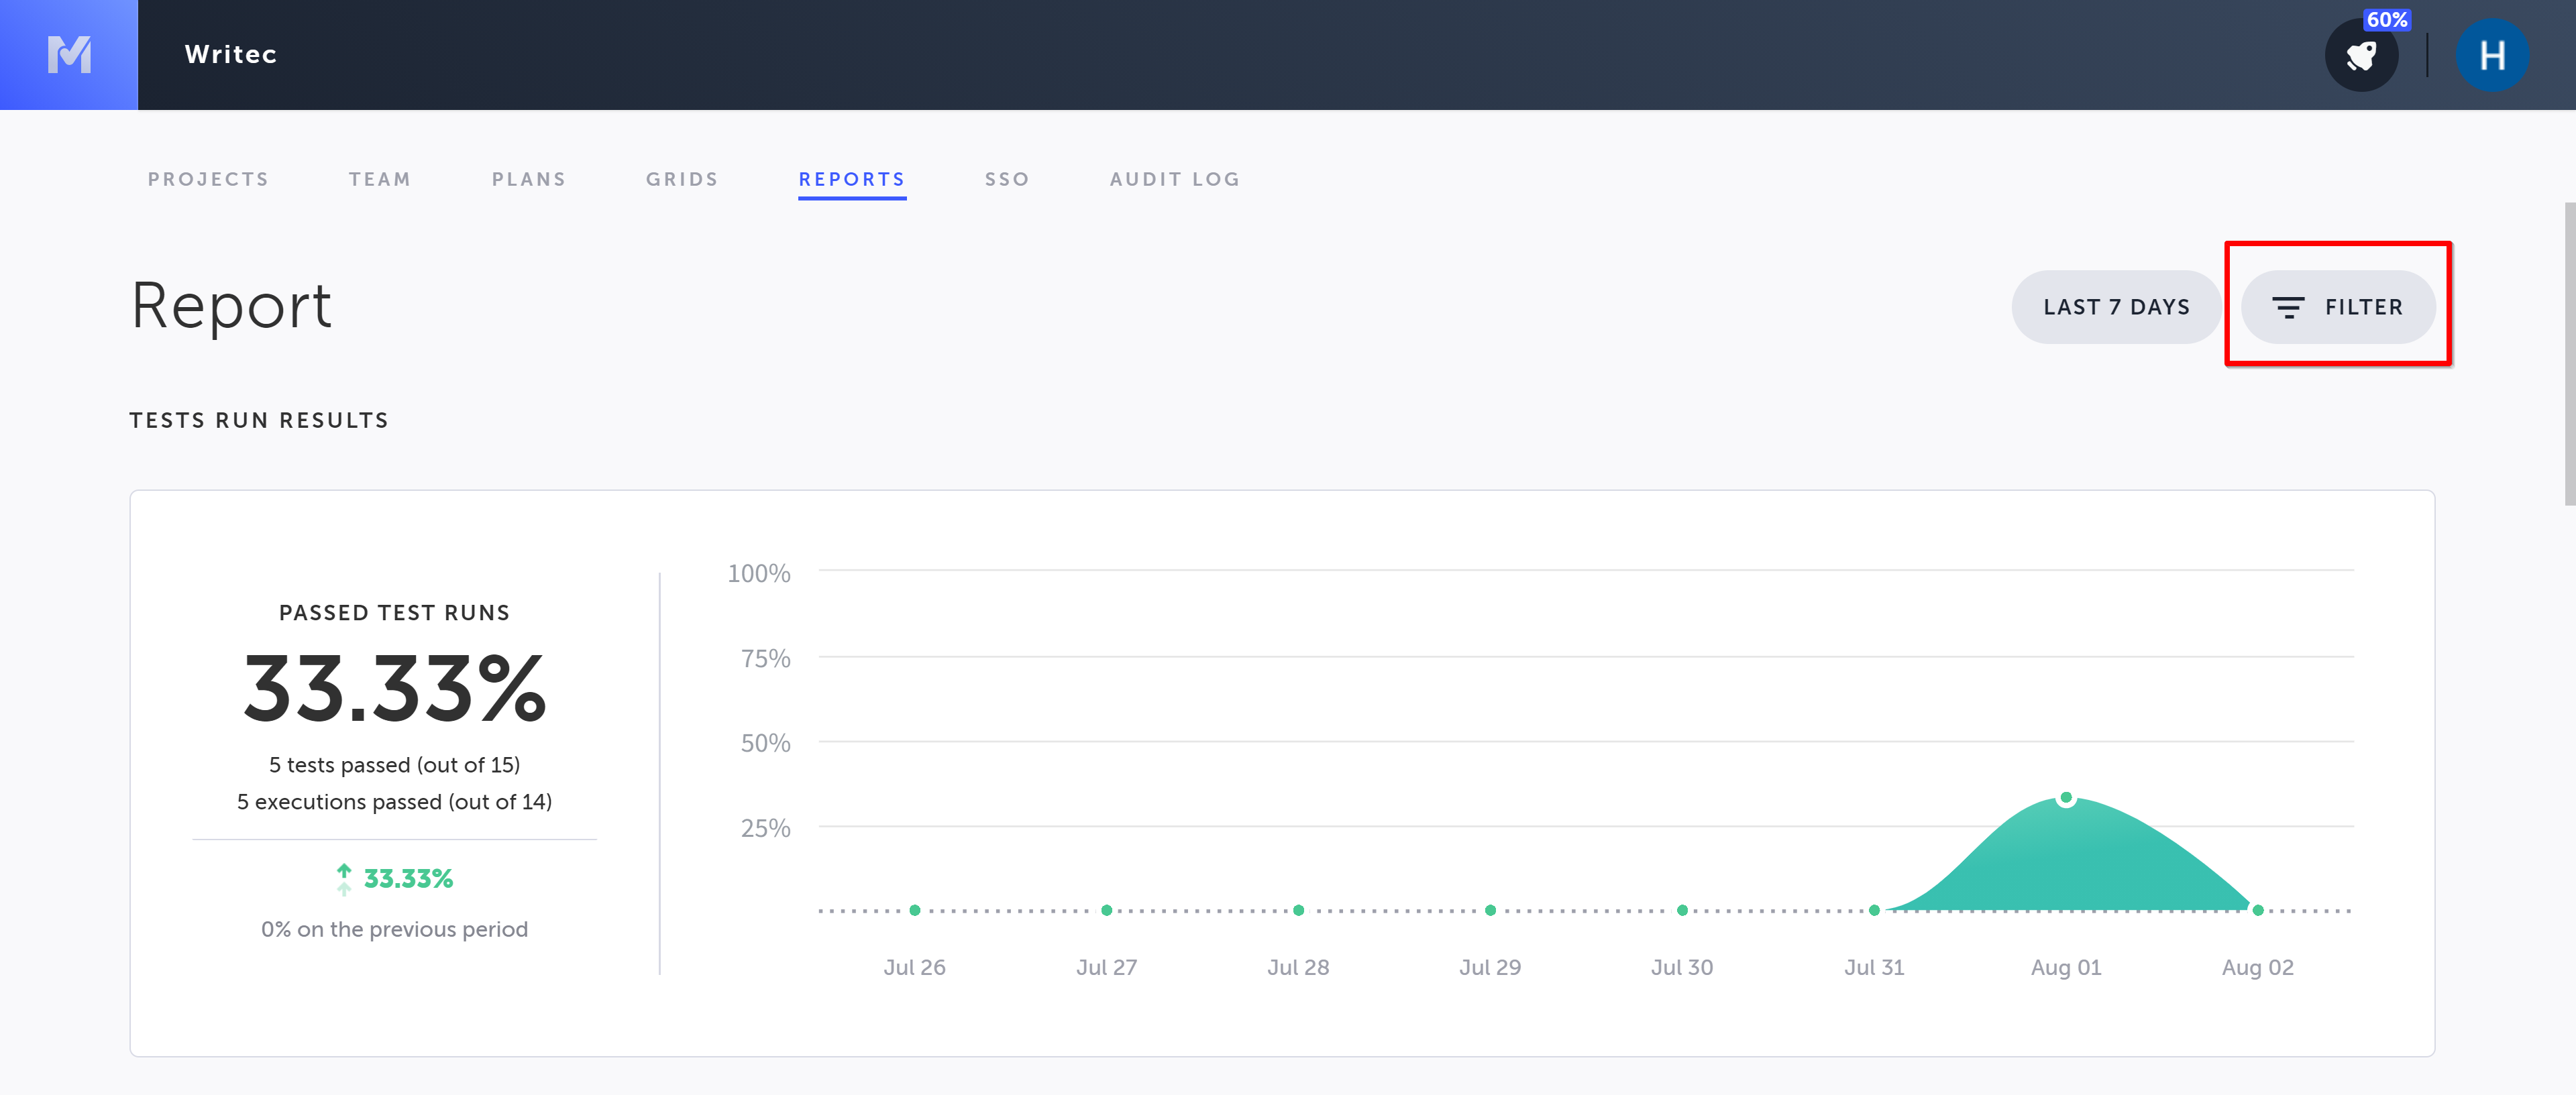
Passed Test Runs

The left side of this pane shows the following test run information for the selected time period:
- The percentage of test runs that passed.
- The number of test runs that passed out of the total number of test runs.
- The number of executions that passed out of the total number of executions.
- The percentage change of the success rate compared to the previous period.
- The (rounded) percentage of test runs that passed during the previous period.
The right side of this pane contains a graph showing the percentage of test runs that passed during the selected time period. Hover over a specific date to see detailed information about the test runs that passed on that date.
Running Tests

This pane includes information about your running tests. A running test is defined as a test that ran at least one time in the selected period.
The left side of this pane shows the following information for the selected time period:
- The number of running tests out of the total number of tests in your Test Library.
- The percentage change of running tests from the previous time period to this time period.
- The number of tests that were run during the selected time period.
The right side of this pane contains a bar graph showing the number of active tests out of the total number of tests in your Test Library for each day of the selected time period. Hover over the bar of a specific date to see the number of running tests out of the total number of tests for that day.
Avg. Duration
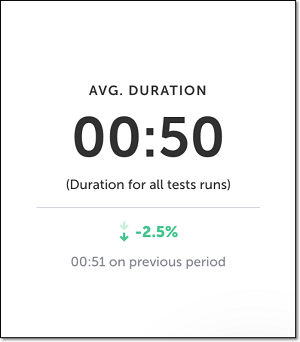
This pane shows the following information about the test run duration. Test run duration is defined as the running time for one run of a single test.
- The average duration for all test runs during the selected time period.
- The percentage change of the average duration of all of the test runs from the previous time period to the current time period.
- The average duration for all of the test runs during the previous time period.
Failure Types


The left side of this pane shows the percentage for each of the failure types that you tagged your failed tests with during the selected time period. It also shows the percentage for the previous time period. By default, only tests that you tagged are included in these figures. To see the entire failed distribution, click the Show untagged toggle.
The right side of this pane contains a chart showing the distribution of how you tagged your failed test runs during the selected time period. You can toggle the view between a donut chart (default) and line chart by clicking on the corresponding button in the top right corner of the pane. When the view is in line chart mode, you can hover over a specific date to see the number of failed tests assigned to each failure type on that date.
For more information about failure tagging, see Tagging failed runs with failure types.
Your Team’s Activity

This section contains one pane showing info about your team’s activity during the selected time period.
The left side of the pane shows the number of new tests created by your team during the selected time period, and the change in the number of new tests created compared to the previous time period.
The right side of the pane shows the number of tests updated by your team during the selected time period, and the number of tests updated by your team during the previous time period.
Testim’s Activity
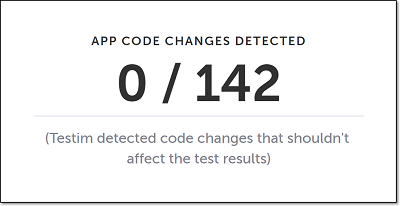
This pane shows the number of times a locator was below the 0.75 threshold, and Testim still found the element, out of the total number of locators. For more information, see Smart Locators.
Where Can You Improve?

This section lists the three tests that have failed the most during the selected time period. Click on any of the listed tests to open the Test Runs page showing detailed statistics of past runs filtered by the test you chose. For more information, see Test Runs Screen. Click on Show All Tests to list all of the tests that have failed five or more times during the selected time period. Tests that have been run less than five times during the selected time period are not displayed in the list.
Filtering the Results
You can filter the data shown in the results by execution run type (suite, plan, scheduler, label, and test), branch, result label, and browser. By default, the data included in the results does not include test runs that have the test status of evaluating; however, you can include these test runs by sliding the Include Evaluating toggle in the Filter settings to the right. For more information on test status, see Test Status. For more information on result labels, see Result labels.
To filter the results:
- Click the Filter button.
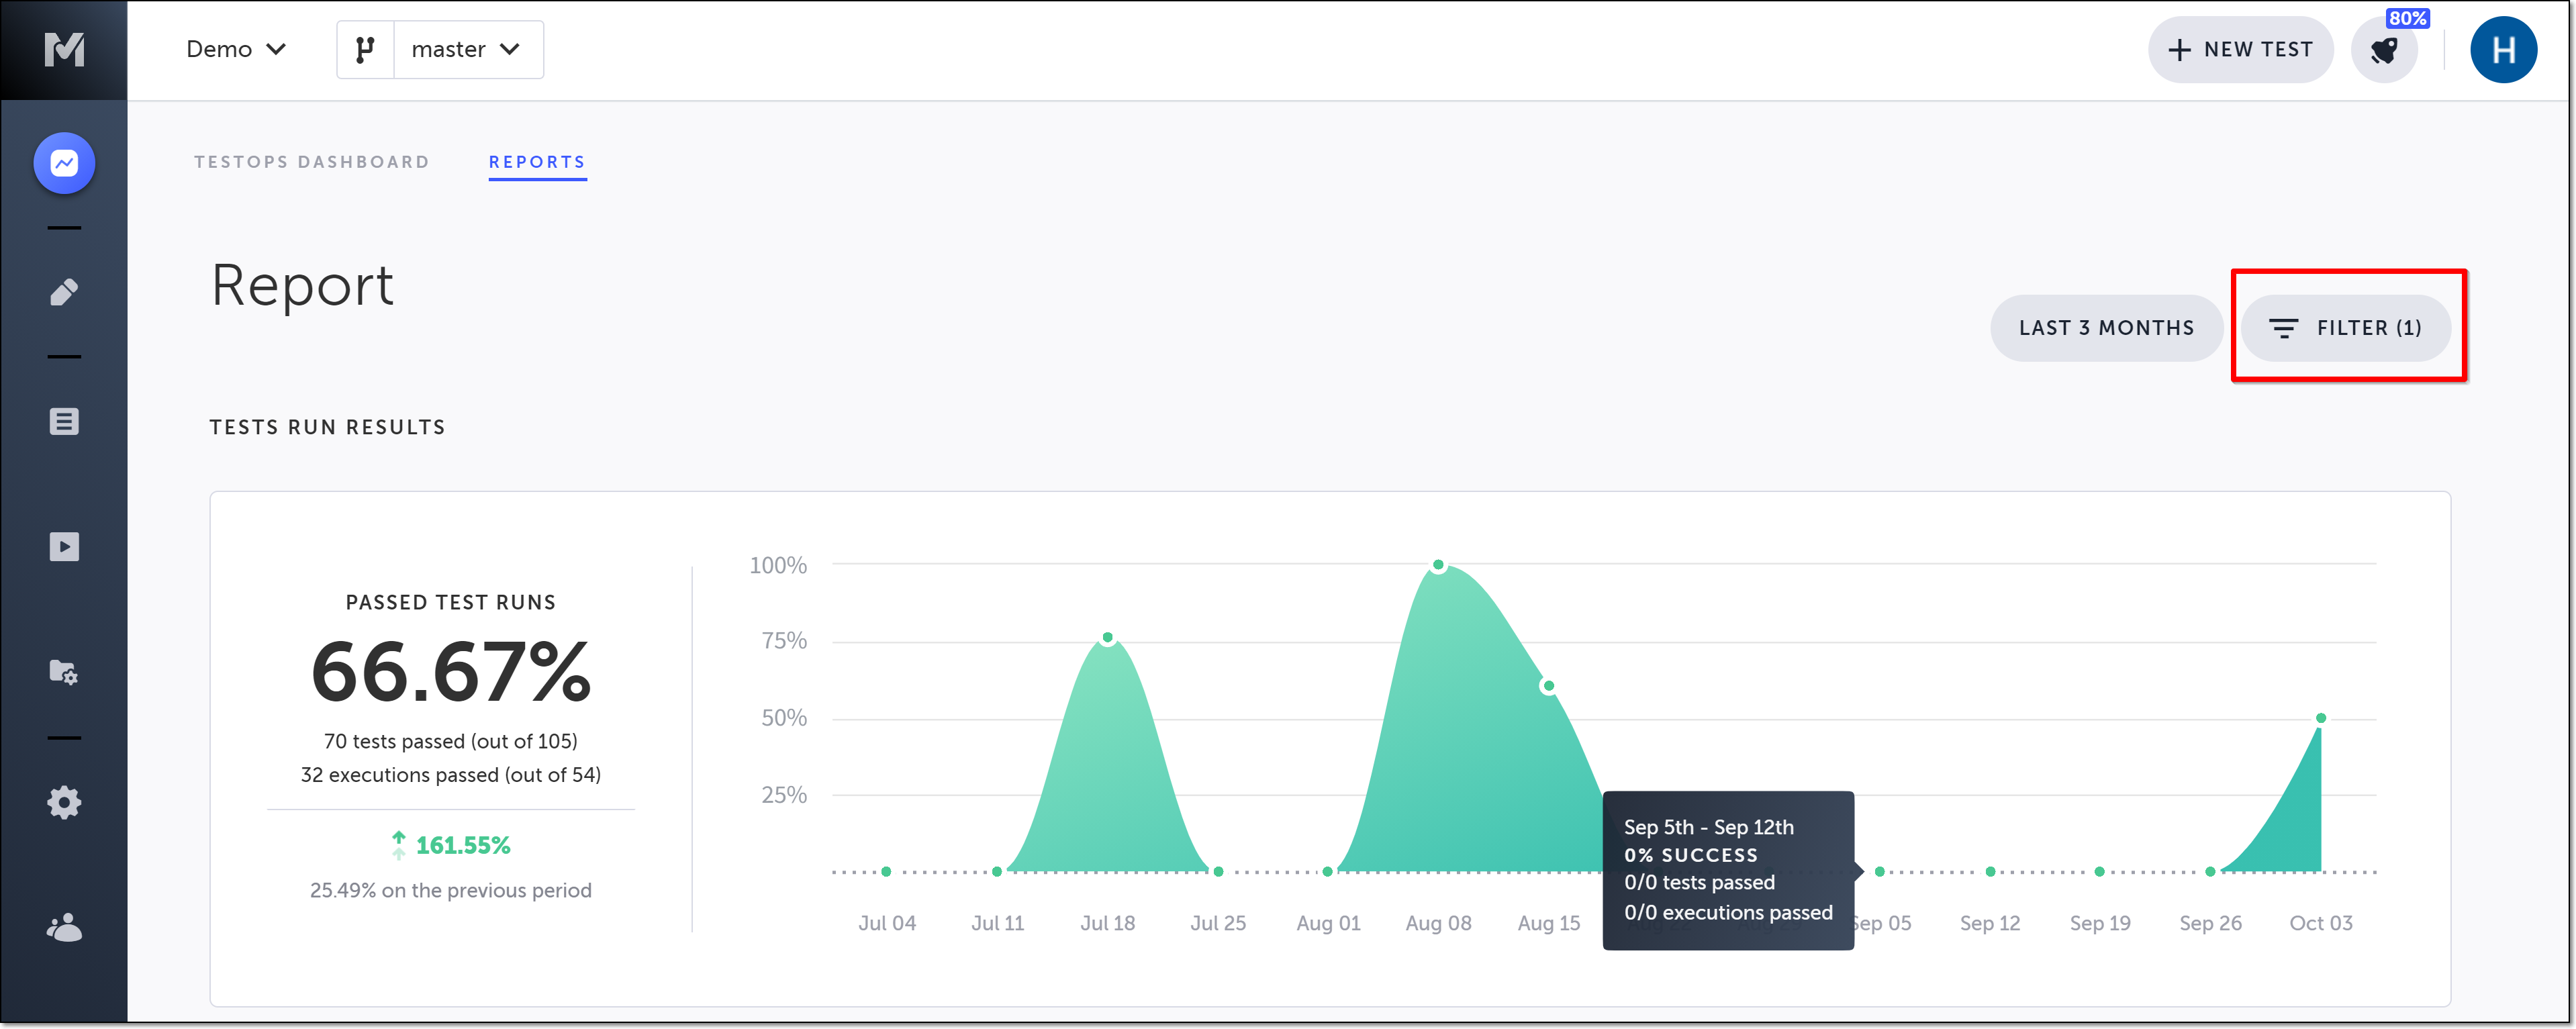
The Filter pane opens on the right-hand side, showing the execution run types you can filter by (Suite, Plan, Scheduler, Label, and Test) and the Branch, Result Labels, and Browsers you can filter by. ( Only the options that are relevant for the chosen time frame are shown.The Result Labels shown are based on the terms you have previously used to label your results. For more information, see Result labels.)

- To filter by a specific execution type, select the type and then select the desired checkbox(es) shown under that type. (You cannot choose more than one execution type to filter by.)
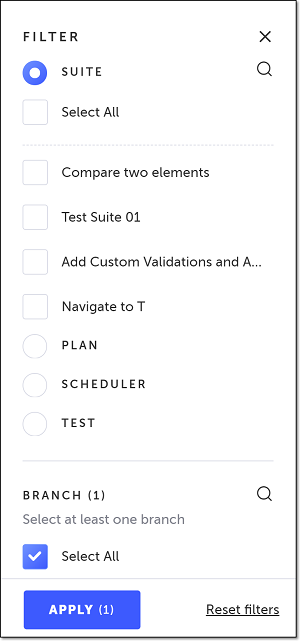
You can also search for criteria by clicking on the Search (magnifying glass) icon and entering your search criteria in the search box that opens.
- To filter by branch, select the desired checkbox(es) in the Branch section. By default, the filter is automatically selected to the branch currently selected at the top of the screen.
- To filter by result label, select the desired checkbox(es) in the Result Label section.
- To filter by browser, select the desired checkbox(es) in the Browser section.
- If you want to include the data from test runs with a test status of evaluating, click the Include Evaluating toggle. A test with the status of evaluating is still being evaluated by the user, so by default the data from its runs is not included. For more information on test status, see Test Status.
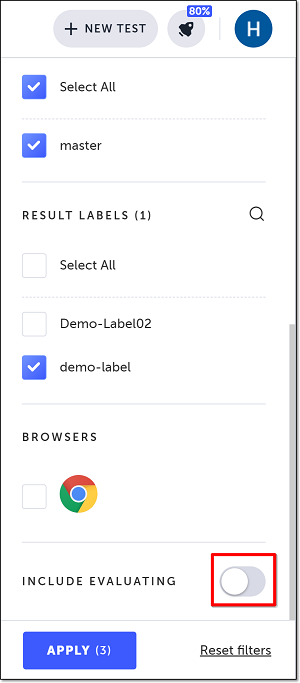
When including the evaluating tests, only the tests that were run on a grid or via CLI are included in the results.
- Click Apply.
The filter is applied, and only the data that meets the criteria is shown.
You can remove the filters by clicking on Reset filters and then Apply in the bottom of the pane.
- Click the “X” in the upper right of the pane to close it.
Closing the Filter pane without resetting the filters will not reset them, and only the data that meets the filter criteria will be shown. To show unfiltered data again, you will need to reopen the Filter pane and reset the filters.
Company-level Report
In addition to the report described above, company owners and project owners can access a more comprehensive, company-level report. Company owners will see all of the information above for all of the projects within the company. Project owners will only see information for their own projects. This report can be filtered by project.
Viewing the Company-level Report
To view the company-level report:
- Click on your account profile image.
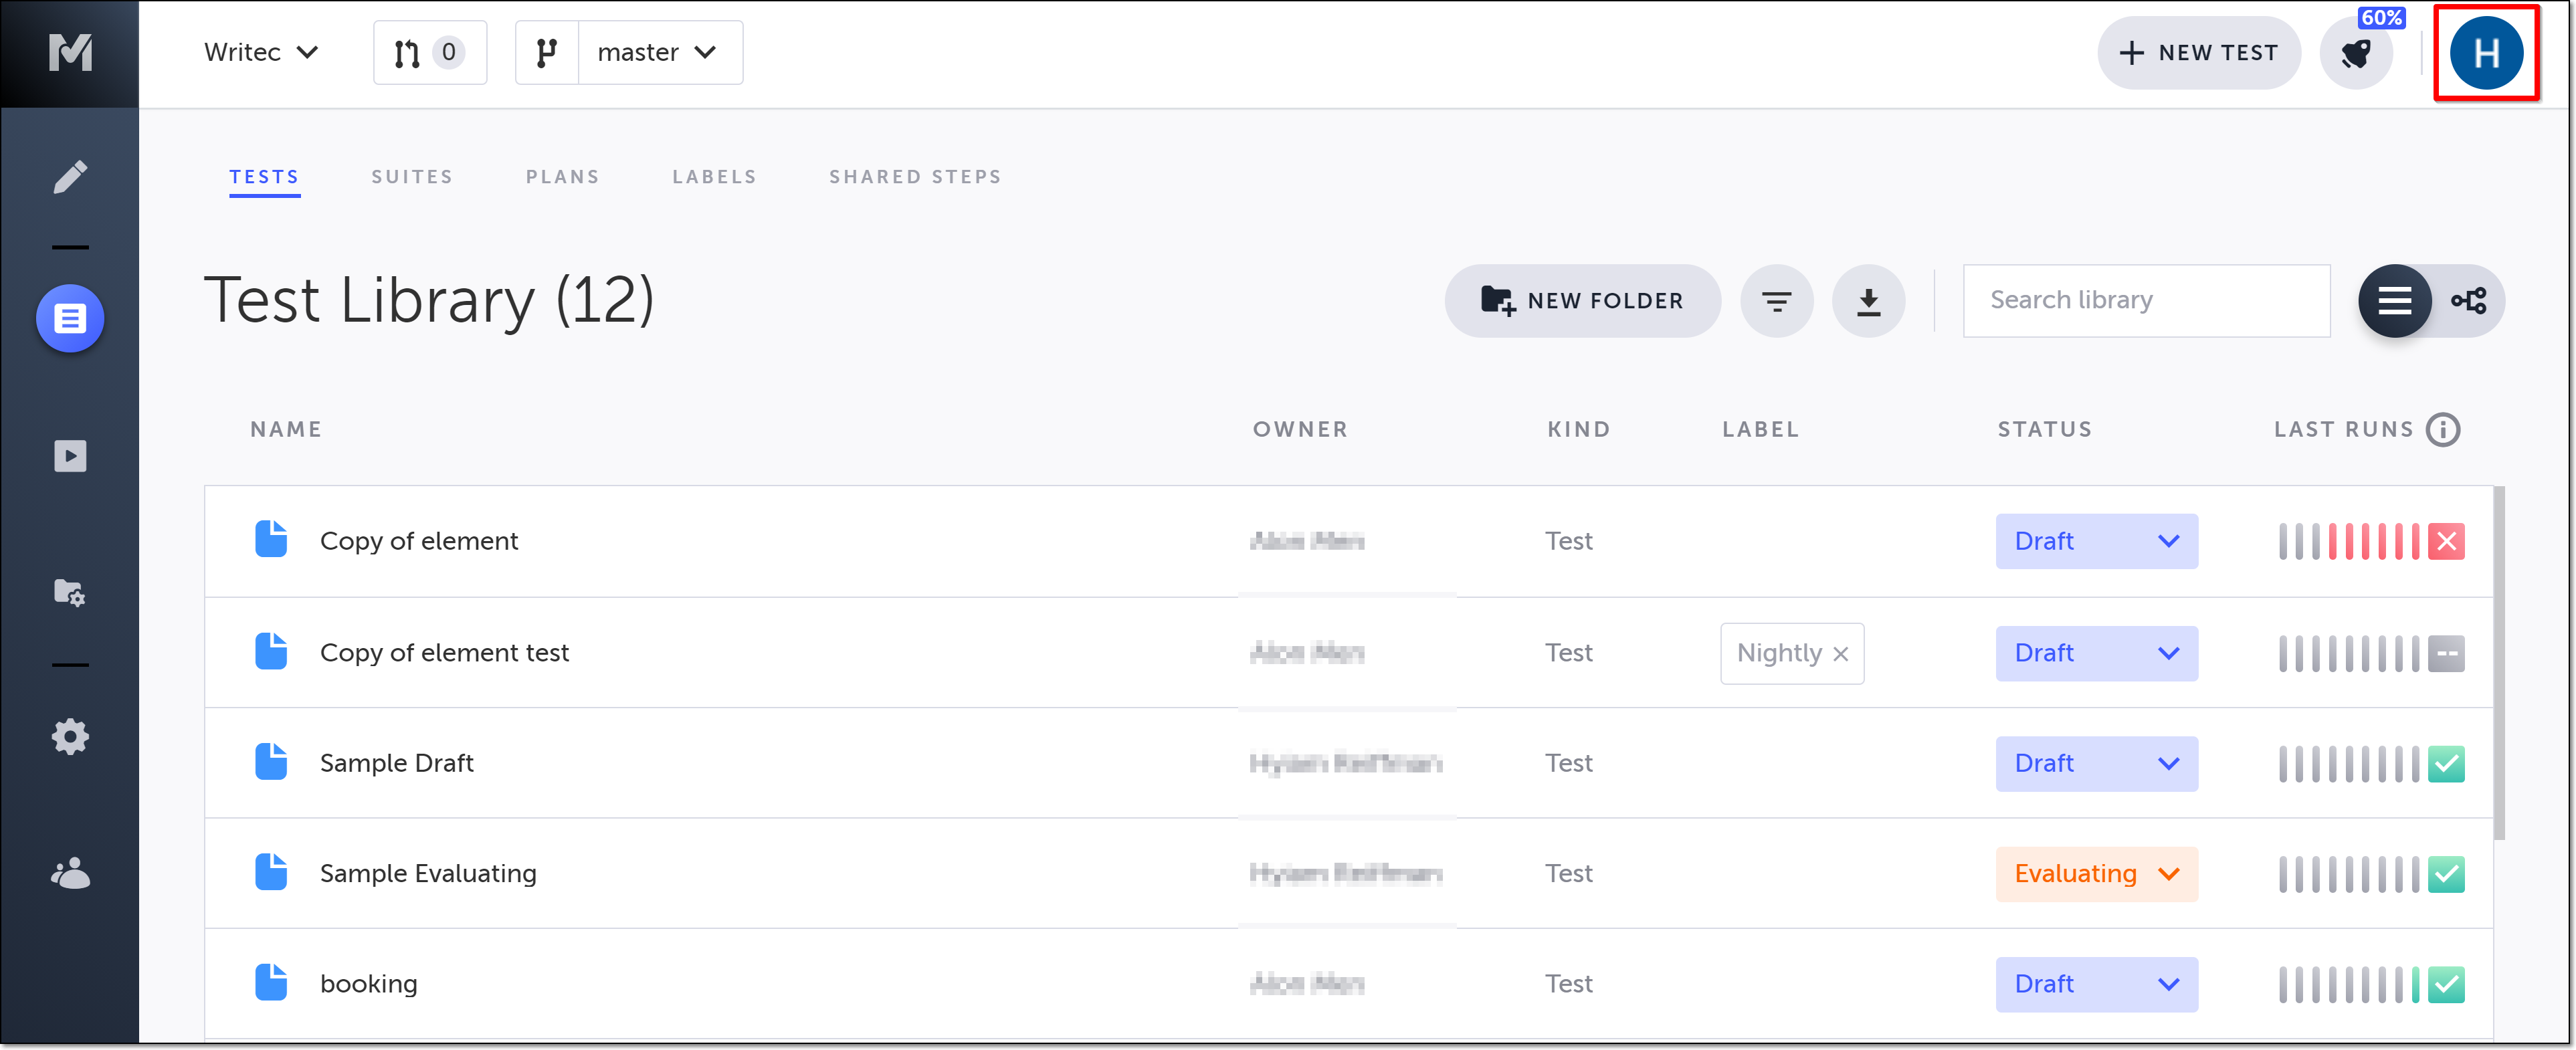
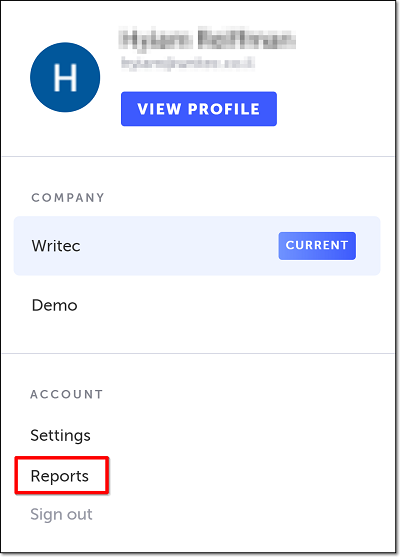
The account menu opens.
- Click Reports.
Alternatively on the Accounts Dashboard, click Reports.
The company-level report opens. For more information about each section, see above.
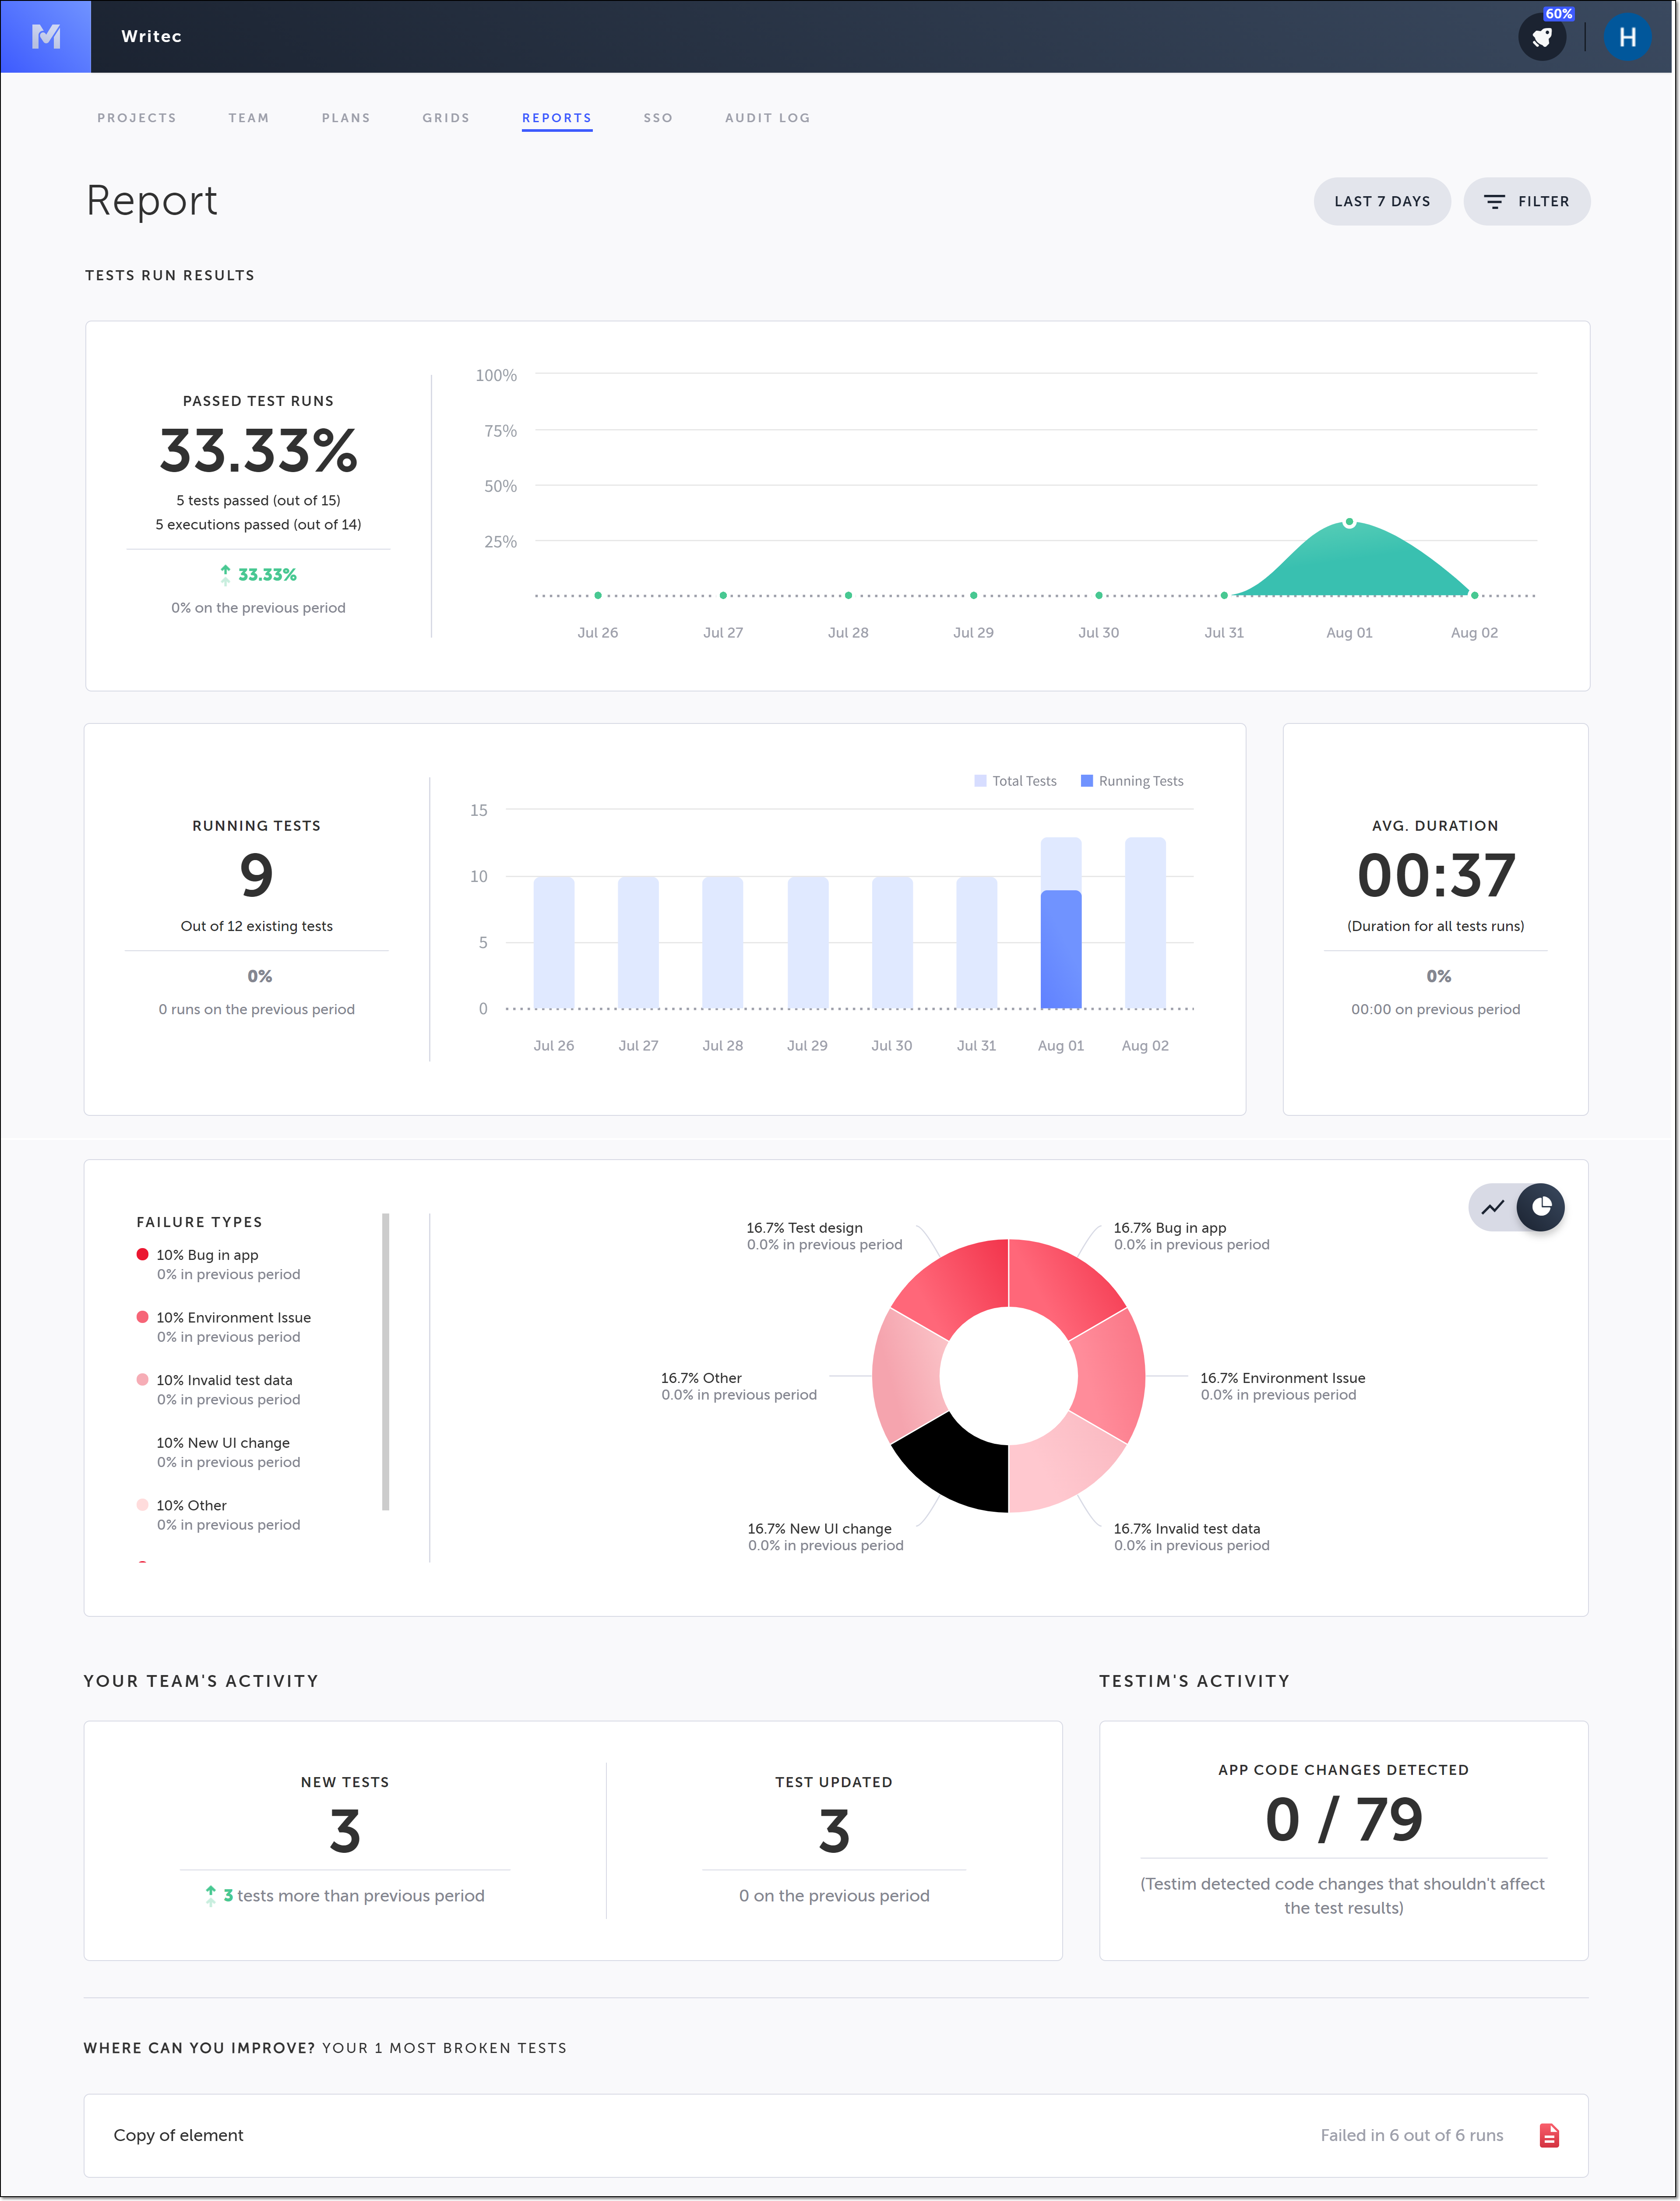
Filtering the Company-level Report
You can filter company-level reports by project. By default, the data included in the report does not include tests that have the test status of evaluating. There is an option in the filter settings to include the data from these tests.
To filter a company-level report:
- Click on the Filter button.
The Filter pane opens on the right hand side.
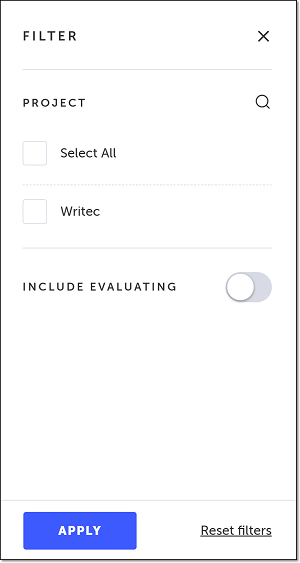
- In the Project section, select one or more projects to filter by.
You can also search for a project by clicking on the Search (magnifying glass) icon and entering your search criteria in the search box that opens.
- If you want to include the data from tests with a test status of evaluating, click the Include Evaluating toggle.
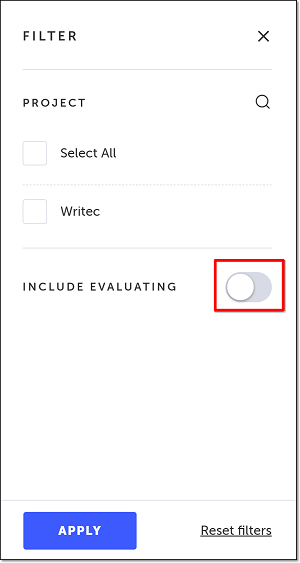
When including the evaluating tests, only the tests that were run on a grid or via CLI are included in the report.
- Click Apply.
The filter is applied, and the report data is updated.
You can remove the filters by clicking on Reset filters and then Apply in the bottom of the Filter pane.
- Click the “X” in the upper right of the Filter pane to close it.
Closing the Filter pane without resetting the filters will not reset them, and only the selected projects will be shown. To include data for all of your projects again, you will need to reopen the Filter pane and reset the filters.
Updated 5 months ago
