
Debug Helper Panels
When Testim editor is used, there are several debug helper panels available during the debugging process to assist test developers in finding and fixing issues.
The following helper panels are available:
- Console log - The console log panel displays messages that are printed to the console during the test's execution. Test developers can use console.log( ) statements in their test code to output variables' values and other debug information. The console log is helpful for understanding what is happening inside the test and can help test developers identify errors or unexpected behavior.
- Breakpoint manager - The breakpoint manager panel allows test developers to easily manage breakpoints in their test. A breakpoint is a point in the test where the test will pause execution, allowing test developers to inspect variables through the test step by step. This feature is useful for identifying the source of errors or unexpected behavior in the test.
- Scope - The scope panel displays information about the current scope of a parameter in the test. The scope refers to the context of the variables within a parameter in the test at each given moment. The scope window can help test developers understand how the test is structured and how data is passed between different test steps.
By default, the debug helper panels are open when you begin test debugging. Project and company owners have the ability to control the default setting of 'console log', 'breakpoint manager' and 'scope' panels from the project settings.
Console Log Helper Panel

The features of the console log:
- Filter Messages - The console log panel allows test developers to filter the messages displayed based the log text and based on the priority level. This feature is helpful when debugging large applications with many messages, allowing test developers to quickly find and focus on the relevant information.
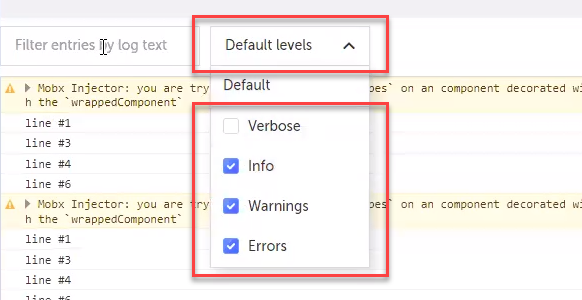
- Log Levels - The console log supports different log levels that test developers can use to categorize their messages. The log levels are error, warning, info and verbose
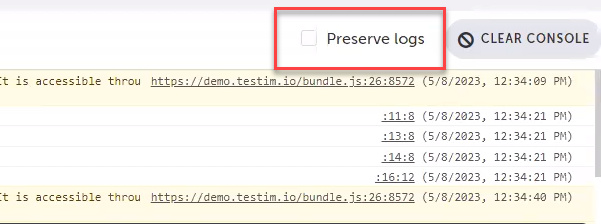
- Preserve Logs - The console log panel allows test developers to preserve the logs even after the page has been reloaded or navigated away from. This feature is useful when test developers need to keep track of previous messages and refer to them later, even after the page has changed.
- Clear Console - The console log panel also includes a "clear" button that test developers can use to clear the messages from the console. This feature is helpful when the console log becomes cluttered with irrelevant or outdated messages, making it difficult to find the relevant information. By clearing the console, test developers can focus on the most recent messages.
Viewing the Console Log During Test Execution
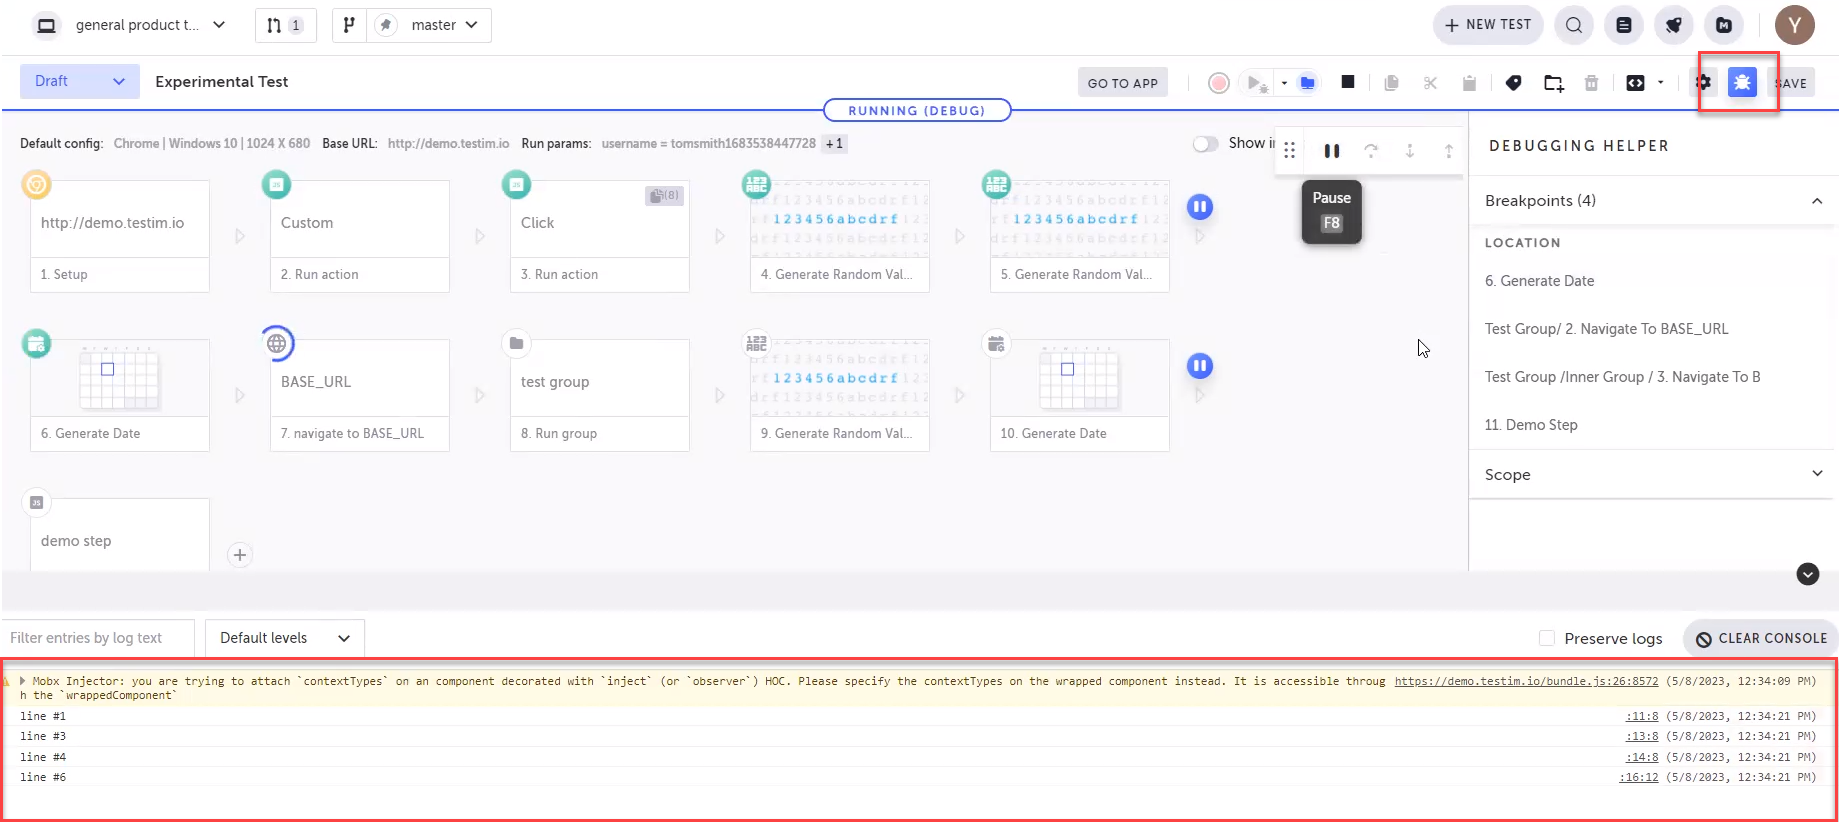
The console log in the Debugging Helper will update in real-time while executing a test.
To view the console log in the Debugging Helper:
- Run the test in the Test Editor.
- Click the Debugging Helper button. This will display the Console Log at the bottom of the screen.
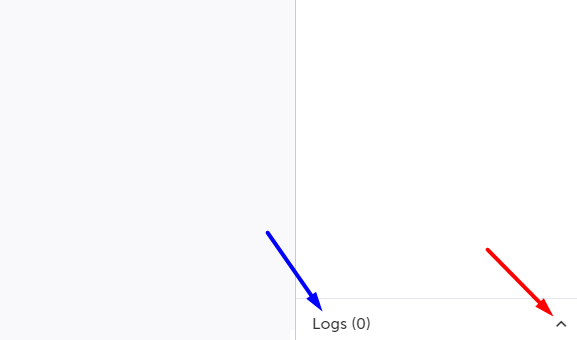
The console log and be expanded and minimized by clicking the arrow next to the Logs title. The number next to the Logstitle displays the number of log messages.
Filtering Console Logs
You can filter the log entries by the text and by their priority level.
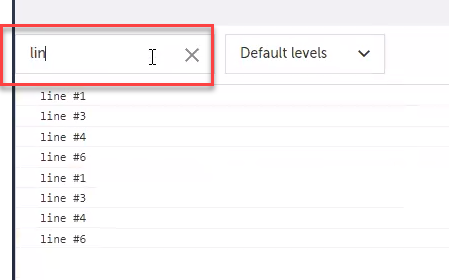
To filter the console logs by text:
- In the Filter entries by log text field enter a text (can be partial text) to only display console entries that match the filter string.
To filter the console logs by priority:
- Click the Levels drop down menu to change the level of console entries displayed in the Console Log.
Preserving Console Log Across Multiple Test Executions
By default when you run a test, the console log will clear. You can force Testim to preserve the console log across multiple test executions. This will append the console log with console entries across test runs, which is helpful when you want to review differences in the console across multiple test runs.
To preserve the console log:
- Click the Preserve logs checkbox in the Console log.
Clearing the Console Log
You can manually clear the console log. This is helpful when you want to clear the log in the middle of a test or you are using the Preserve Log feature.
To clear the console log:
- Click the Clear Console button in the Console Log to clear all console entries.
Breakpoint Manager Helper Panel
The breakpoint manager helper panel lets you manage the various breakpoints in the test, including:
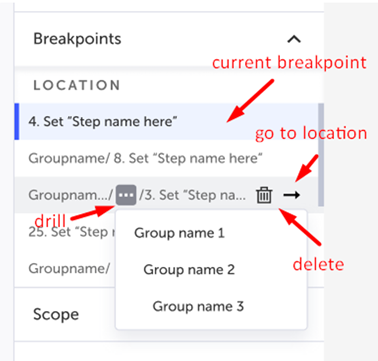
- Delete Breakpoints - The breakpoint manager allows test developers to delete breakpoints that they have set in their test. By deleting a single breakpoint or all breakpoints that are no longer necessary, test developers can avoid pausing the program unnecessarily and save time when debugging.
- Go to Location - The breakpoint manager also allows test developers to quickly navigate to the location of a breakpoint in their test. This feature is useful when test developers have many breakpoints set in their code and need to quickly find a specific one.
- Current Breakpoint - The breakpoint manager displays information about the current breakpoint, where the test has currently paused. This feature is useful when test developers need to quickly see where the program is paused and what variables are available at that point in the test.
Viewing Breakpoints in the Debugging Helper
You can view a list of all breakpoints and their locations in the Debugging Helper.
To view breakpoints in the Debugging Helper:
- Run a test in the Testim Editor until the test hits a breakpoint.
- Click the Debugging Helper icon.
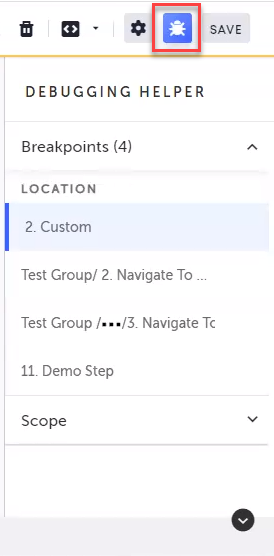
- This will open the Debugging Helper panel.
- Expand the Breakpoints section to view the locations of all breakpoints in the test.
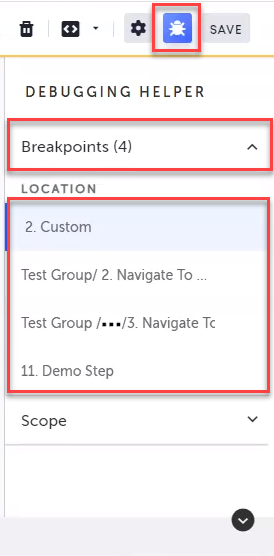
The Debugging Helper will highlight the currently active breakpoint.
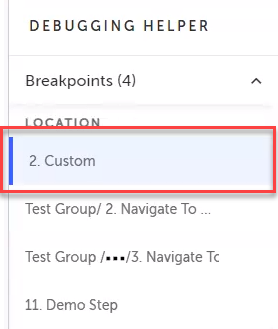
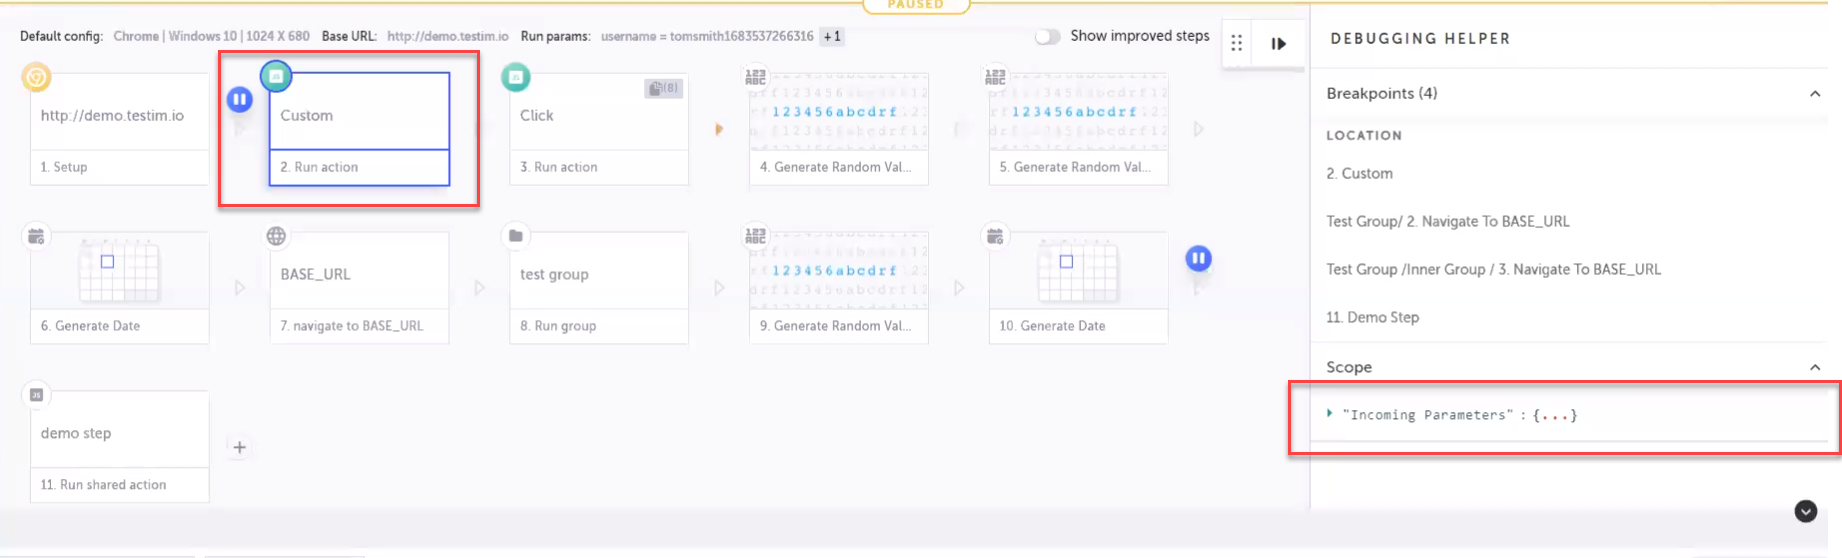
The format of the Location for each breakpoint helps identify where in the test hierarchy each breakpoint can be found:
- First level breakpoints are indicated by the step number followed by the step name.
- Inner level breakpoints, which are breakpoints placed on a step that is located inside a group, are indicated by the name of the group followed by the the step number and name.
- Compound level breakpoints, which are breakpoints that are placed within a group that is within another group, are indicated by the ellipsis. Clicking on the ellipsis will reveal the group names.
Navigate to a Breakpoint Location within the Test
A single test may contain many breakpoints. Breakpoints may also be present within test groups or sub test groups.
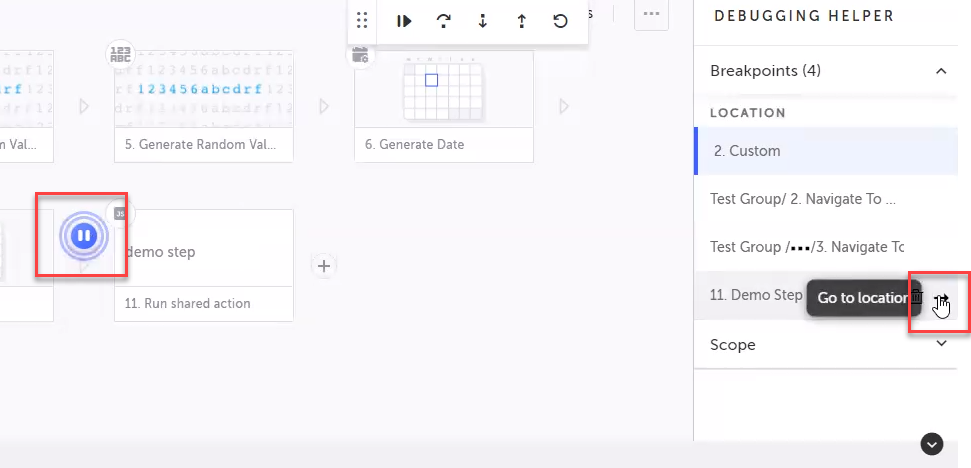
To navigate to a breakpoint location:
- Locate the breakpoint in the Debugging Helper.
- Click the Go to location button to the right of the breakpoint. The breakpoint location will be highlighted in the Test Editor.
Delete Breakpoints
You can delete breakpoints from within the Debugging Helper panel.
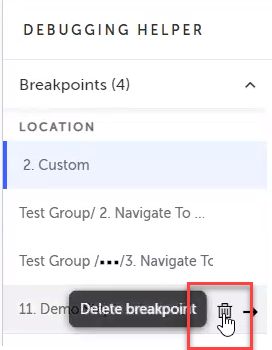
To delete a single breakpoint:
- Open the Debugging Helper panel.
- Navigate to the breakpoint you want to delete.
- Hover over the breakpoint and click the Delete breakpoint button.
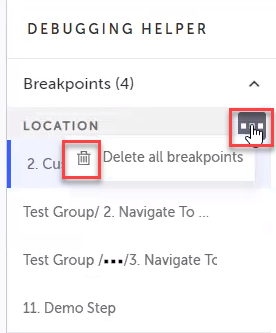
To delete all breakpoints in a test:
- Open the Debugging Helper panel.
- Hover over the Location section until the elipsis appears and click the Delete all breakpoints button.
Scope Helper Panel
The scope panel in the editor displays information about the variables in the test steps. The scope refers to the test “area” where a variable can be accessed and used. When the test is paused at a breakpoint, the scope panel shows information about the variables available in the current scope.
The scope panel typically displays information about the name, type, and value of each variable in scope. This information can be useful when debugging tests, as it allows test developers to quickly see what data is available and how it is being used. For example, test developers can use the scope window to inspect the values of variables and identify any issues or unexpected behavior.
Viewing Test Variables and Scope
You can view all variables used during execution in the Debugging Helper.
To view variables and their scope:
- Run the test in the Test Editor to completion or a breakpoint.
- Click the Debugging Helper button to open the Debugging Helper.

- Expand the Scope section to display all variables from the test and their scope.
Note:The Debugging Helper panel will only display variable for steps that have been executed in the test. If a test stops or pauses before the end of a test, the Debugging Helper will not display variables related to future steps that have not yet been executed.
- Click on any step earlier in the test to view all variables in scope up until that step was executed.
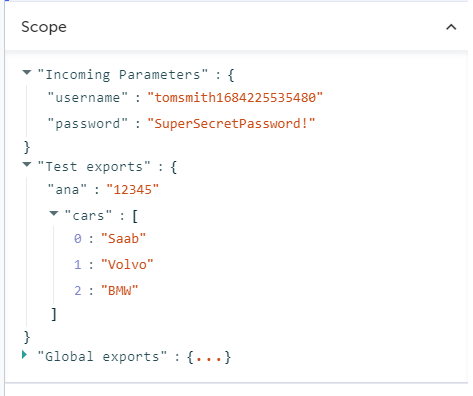
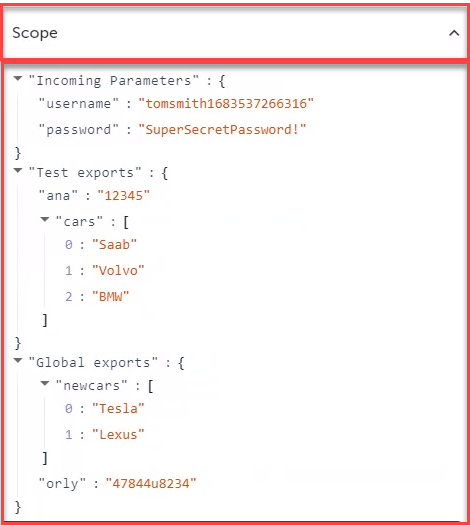
The following types of parameters are displayed in the Scope section of the Debugging Helper:
- Incoming Params: variables configured to be used by a step in the test.
- Test Exports: variables created by a test and available for use by other steps in the test.
- Global Exports: variables created by a test and available for use by other tests in the test plan.
Updated 6 months ago