
Test runs
View statistics of last test runs
The "Test Runs" screen enables you to view statistics on past runs. The screen displays aggregated statistics on all the selected tests as well as statistics on specific tests (e.g., the number of times it passed/failed and the average test duration, etc.).The screen is divided into the following tabs:
- Counted Runs - this tab displays statistics on past runs that were run locally or remotely by the CLI, CI, or scheduled runs. These test runs are counted towards your subscription quota.
- Local Editor Runs - this tab displays statistics on past runs that were run directly from the editor. These test runs are not counted towards your subscription quota.
How to access the Test Runs screen
There are two different ways to access the "Test Runs" screen:
- On the main menu, click Runs >Test runs .
- From the Execution Runs screen (Runs => Executions), select a run, right click a test, and select the Test history option.
Test Runs screen elements
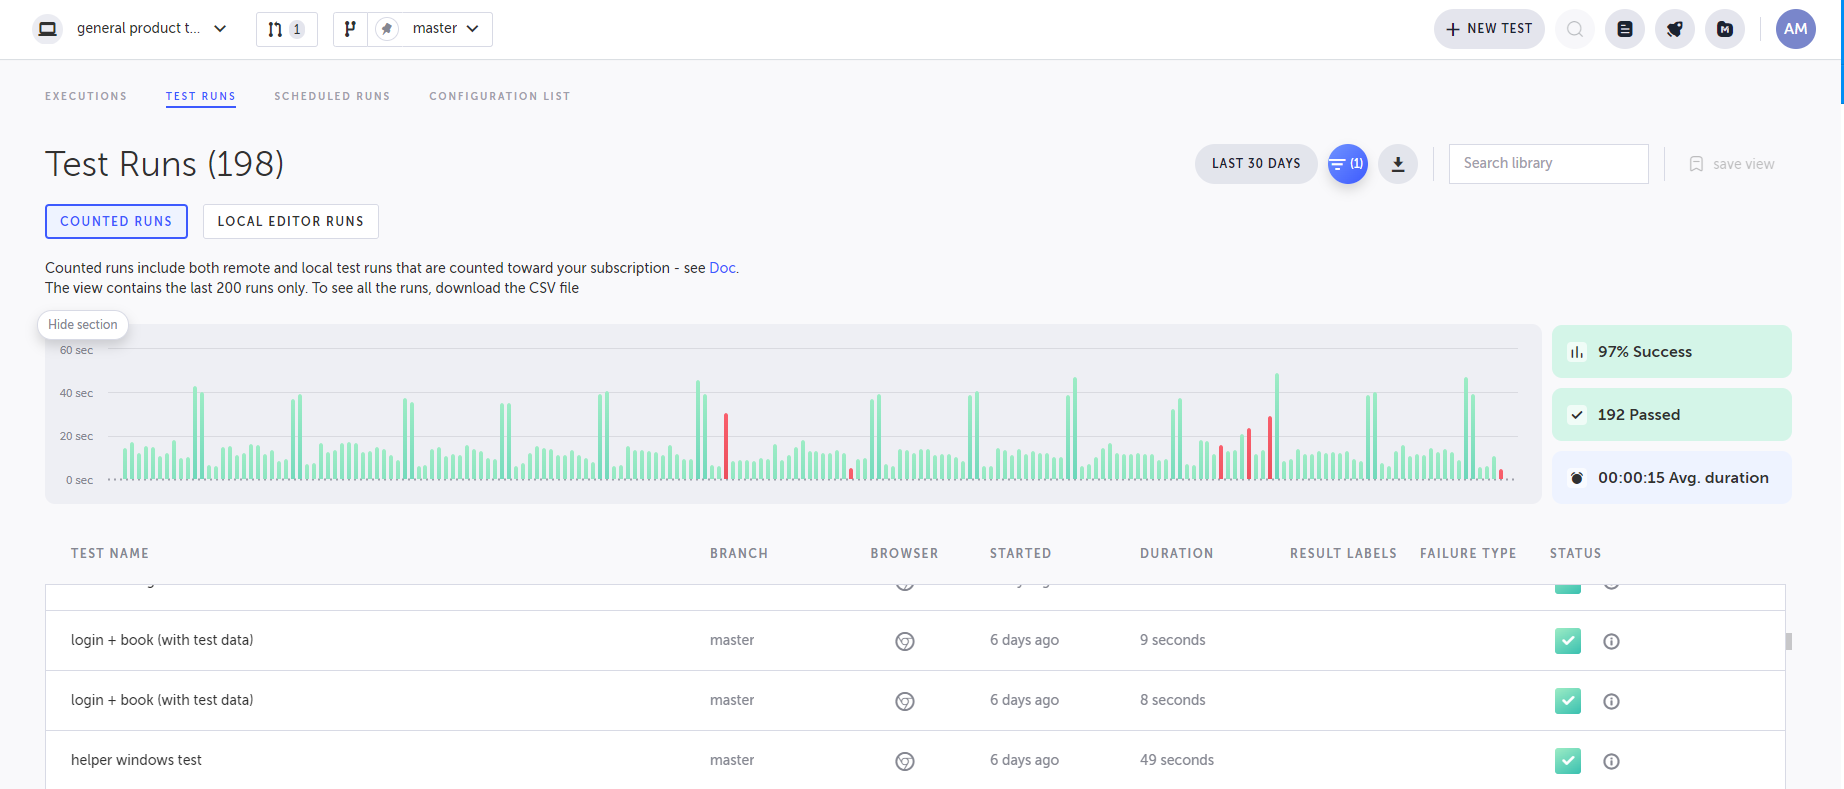
The Test Runs screen displays statistics on the last runs for a specific test / all tests according to the selected filters. When you navigate to this screen from a specific test, you'll see the statistics for that test only. Clicking on a specific test run will open that test run inside the Test Editor allowing you to drill down and see the test run details e.g. screenshots and duration of each step.
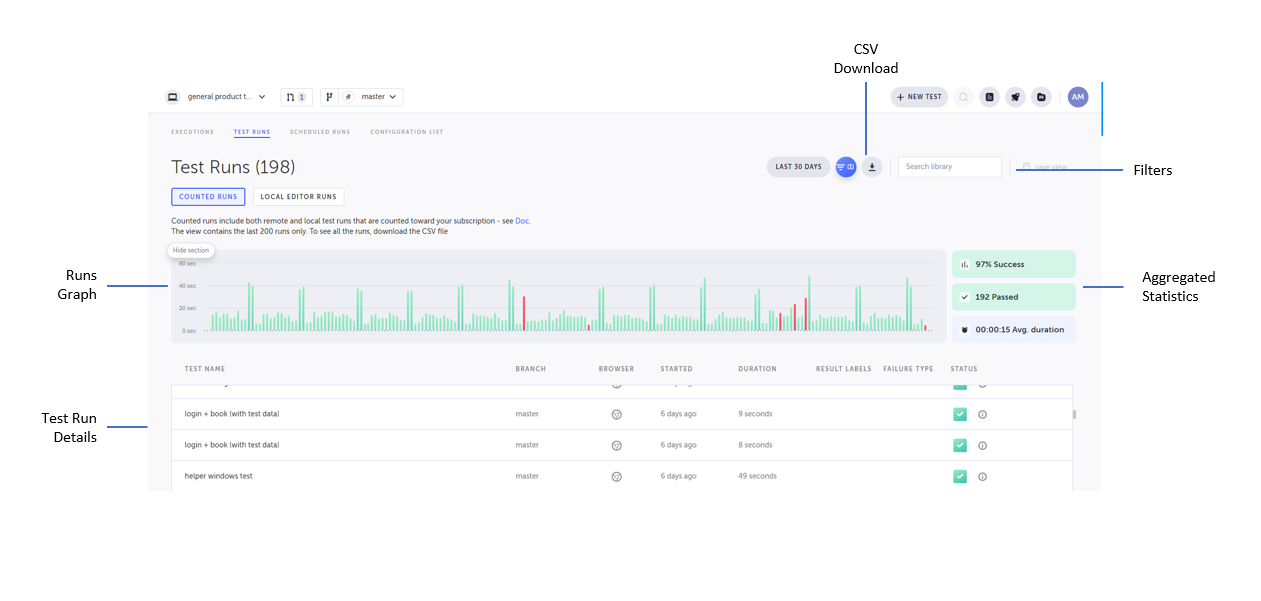
Aggregated Statistics
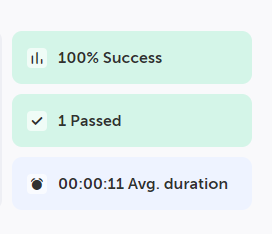
The Aggregated Statistics section displays the following summary of the results from all runs:
- Success - the percentage of the successful runs out of all the runs that ran during the selected time.
- Passed - how many test runs succeeded
- Avr. duration - The average duration of the runs
Filters
You can filter the statistics based on the following parameters. Filters are shared between the “counted runs” tab and the “local editor runs” tab. The filters can be aggregated by selecting multiple filters.
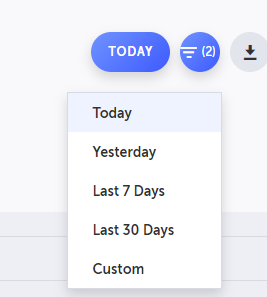
Period of time filter
Click the filter and select one of the predefined options or Custom to specify a specific start and end date.
Search
Enter a search query to search for test results with matching Test names.
Advanced filters
Click the Advanced Filters button to open the Filter Test Runs pane.
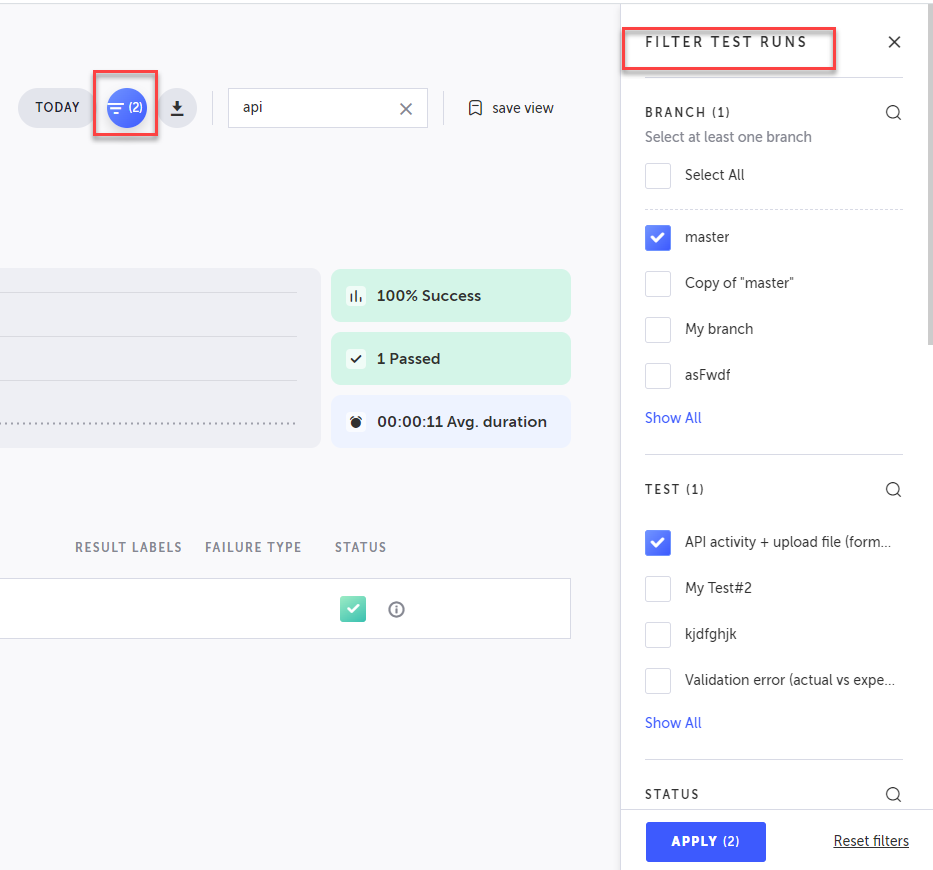
The Advanced Filters pane features the following filters:
- Branch - select Select All to include all filters or select a specific branch from the list.
- Tests - select specific test or all tests.
- Status - select a specific test run status.
- Failure type - Failed runs are tagged with a reason. You can use this filter to display the runs that were tagged with one of the listed reasons. Selecting this filter will display failed tests only.
- Browser - select the desired browsers that were used in the test run. (web only)
- Test Owner - select the relevant owner of the test. The owner of the test is not necessarily the user that has executed the test.
To learn more about saving this filtered view, see Saving a Filtered View.
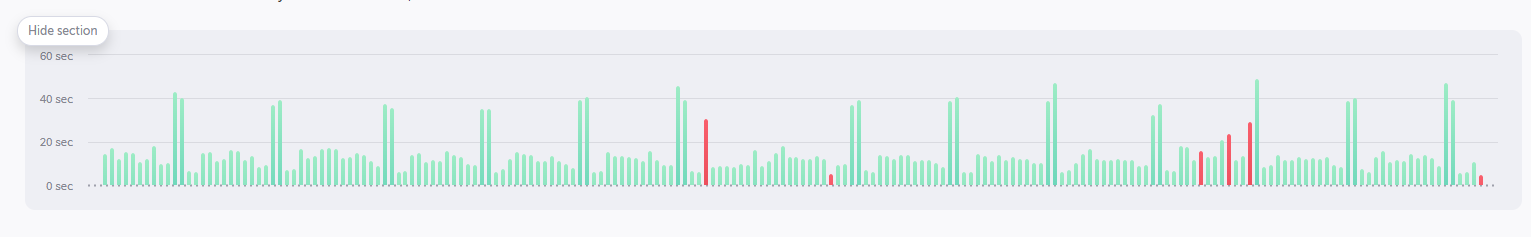
Runs Graph
The runs graph displays the duration (y-axis) across time (x-axis). Each bar represents a test run as following:
- Green bars - passed
- Red bars - failed
You can hover over a bar to view its details.
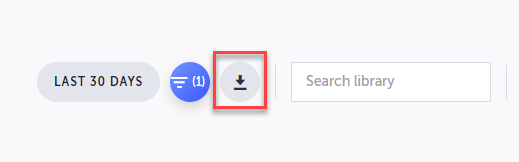
Download to CSV
By default, the test runs shows up to 200 results. When there are more than 200 results, downloading the CSV will contain all the results. CSV download available only for “counted runs”
To download the CSV click the CSV Download button and select the destination.
Tag test failure
Click the Tag Test Failure button to tag all the failed runs in the list below with failure types . To learn more - see Tagging failed runs with failure types

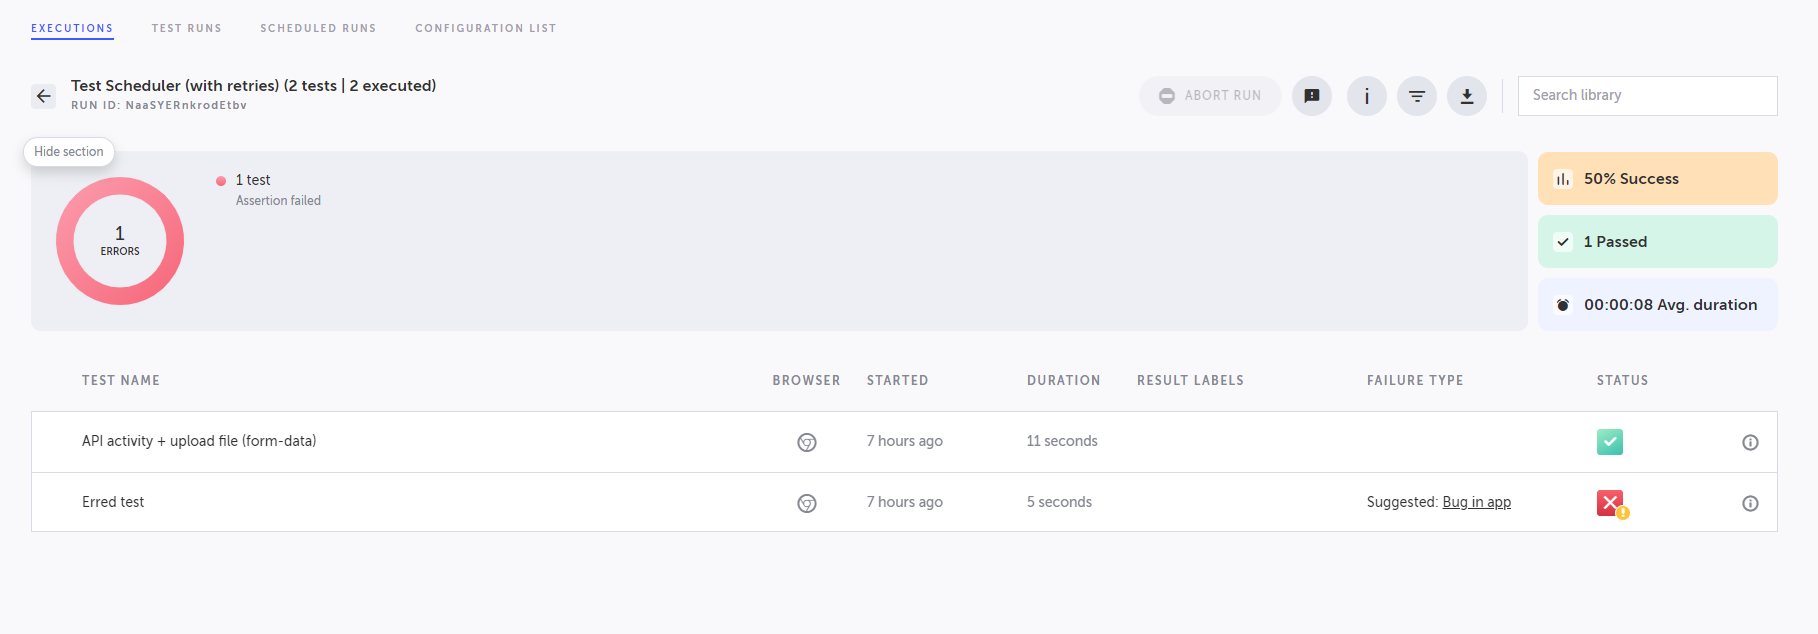
Test Runs Details
The test runs details lists all the test runs that match the conditions of the filters.
Parameter | Description | Values |
|---|---|---|
Test Name | The name of the test in the test run. | |
Branch | The branch that holds the test that was run | |
Browser (web) | The browser that was used in the test run. | |
Device (mobile) | The device that was used in the test run. | |
OS | The operating system that was used in the test run. | |
Started | The time the run has started. | |
Duration | The duration of the test run. | |
Result Labels | The result label that was added to the run. Click to view the labels. | |
Failure Type | The failure tag that was added to the run. To add a Failure Tag, click the "Tag test failure" link. Lear more - Tagging failed runs with failure types | |
Status | The test run status. |
|
Viewing retries
When a test run had a few retries, it is possible to view the retries' results. Test run with retries will have a yellow (!) marking on the status icon.
To read more about retries and how to set them up, see here
To view all retry results for a specific run:
- Hover the result line
- Click the "Test retries" icon
- Open the result you would like to view
In case your plan does not support viewing retries, please contact support.
Updated 5 months ago